Geoscience Reference
In-Depth Information
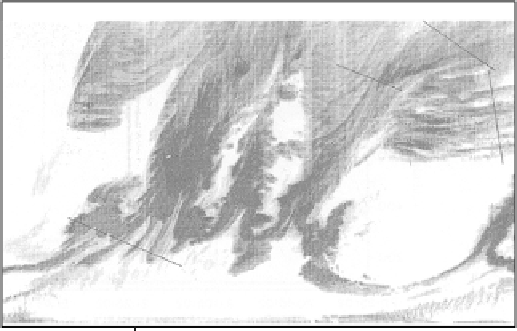
Jicamarca spread-F
6 Oct 84 19:07:20
1100
D
1000
900
800
700
600
B
C
500
400
300
A
200
100
20
21
22
Local time (758W)
100
200
300
400 500
Horizontal distance (km)
600
700
800
900
1000 1100
Figure 4.8
A spectacular CEIS event detected at Jicamarca. The labeled lines show cuts
made though the data orthogonal to visible periodic layering. Fourier analysis shows a
characteristic separation of 50 km. Notice the short-period structures drawn out of the
100-110 km region where the equatorial electrojet instabilities occur. [After Hysell et al.
(1990). Reproduced with permission of the American Geophysical Union.]
As we shall see following, winds and waves in the neutral atmosphere may
be responsible in part for some of these characteristics scales. But before we can
explore these processes, we need to understand plasma instability theory as it
applies to these equatorial ionospheric storms.
4.2 Development and Initiation of Convective Equatorial
Ionospheric Storms (a.k.a. Equatorial Spread F)
4.2.1 Linear Theory of the Rayleigh-Taylor Instability
Dungey (1956) first proposed the Rayleigh-Taylor (RT) instability as the process
driving CEIS. This mechanism was temporarily rejected along with all the other
candidate theories by Farley et al. (1970), since, as we shall see, it seemed capable
only of generating structure on the bottomside of the F-region plasma density
profile. The manner in which the RT instability can cause irregularities to grow
in the equatorial ionosphere is illustrated in Fig. 4.9a, using a two-dimensional
model. Here the steep upward-directed gradient, which develops on the bottom-
side of the nighttime F layer (see Chapter 3), is approximated by a step function.


Search WWH ::

Custom Search