Geoscience Reference
In-Depth Information
500
1979
1999
2005
2010
40
450
El Chichon
(April 1982)
Mount Pinatubo
(June 1991)
400
20
350
60-90ºN March
300
0
250
-20
200
October zonal average
150
-40
60-90ºS October
100
1980
1990
2000
2010
-90
-60
-30
0
30
60
90
(a) Year
(b) Latitude (degrees)
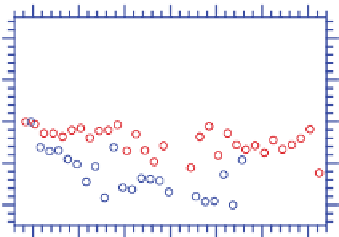
Figure 11.10.
(a) Percentage difference in March-averaged 60
◦
Nto90
◦
NandOctober-averaged 60
◦
Sto90
◦
S
ozone column abundances between the given year through March 2011 and 1979. (b) Variation with latitude of
October monthly and zonally averaged column abundances of ozone during 1979, 1999, 2005, and 2010.
No data were available from December 1994 to July 1996. Data were obtained from the satellite-based Total
Ozone Mapping Spectrometer (TOMS) and made available by NASA Goddard Space Flight Center,
Greenbelt, Maryland.
stratosphere drop sufficiently for certain ice particles to
form and chemical reactions involving anthropogenic
chlorine and bromine to occur on their surfaces. The
products of such reactions eventually destroy ozone.
When the dent does not appear, it is because Arctic
stratospheric temperatures are too warm for the ice par-
ticles to form.
1998 increased ground UV-B radiation during 1998
by about 7 percent in NH midlatitudes in winter and
spring, 4 percent in NH midlatitudes in summer and
fall, 6 percent in SH midlatitudes during the entire year,
130 percent in the Antarctic in the SH spring, and
22 percent in the Arctic in the NH spring (Madronich
et al., 1998). Localized measurements of UV at Lauder,
New Zealand (45
◦
S), similarly showed surface UV-B
radiation levels 12 percent higher during the SH sum-
mer of 1998/1999 than during the early 1990s (McKen-
zie et al., 1999).
Surface measurements suggest, though, that in the
SH, such as in Lauder, New Zealand, and at the South
Pole, UV reaching the surface declined slightly between
1999 and 2006, suggesting a slight recovery in strato-
spheric ozone (McKenzie et al., 2007). However, in the
NH, UV levels generally increased during this period,
not due to a loss of stratospheric ozone, but due to
areduction in
UV-absorbing particulate matter
air
pollution in the NH.
11.4.4. Effects of Ozone and Air Pollution
Changes on Ultraviolet Radiation
Ozone reductions increase UV radiation penetration
to the surface. Ozone losses between the 1970s and
500
March zonal average
450
1979
2005
2010
2011
400
350
300
250
11.5. Effects of Chlorine on Global
Ozone Reduction
Ozone reductions since the late 1970s correlate with
increases in chlorine and bromine in the strato-
sphere. Molina and Rowland (1974) first recog-
nized that anthropogenic chlorine compounds could
destroy stratospheric ozone. Since then, scientists have
strengthened the links among global ozone reduction,
Antarctic ozone depletion, and the presence of chlorine-
and bromine-containing compounds in the stratosphere.
200
-90
-60
-30
0
30
60
90
Latitude (degrees)
Figure 11.11.
Variation with latitude of March
monthly and zonally averaged column abundance of
ozone during 1979, 2005, 2010, and 2011. Data were
obtained from the satellite-based Total Ozone
Mapping Spectrometer (TOMS) and made available
by NASA Goddard Space Flight Center, Greenbelt,
Maryland.


Search WWH ::

Custom Search