Geoscience Reference
In-Depth Information
11.4.2. Antarctic Stratospheric Changes
Between 1950 and 1980, no measurements from three
ground-based stations in Antarctica showed ozone
levels less than 220 DUs, the threshold defining Antarc-
tic ozone depletion. Every SH spring (September-
November) since 1980, measurements of stratospheric
ozone have shown a depletion. Farman et al. (1985) first
reported depletions of more than 30 percent relative
to pre-1980 measurements. Since then, measurements
overthe Antarctic have indicated depletions of up to 70
percent of the column ozone for a week in early October.
The largest average depletion for the month of October
from 60
◦
Sto90
◦
Ssince 1979 was 42.4 percent and
occurred in 2006 (Figure 11.10a). Most ozone deple-
tion occurs between 12 and 20 km in altitude. The large
reduction in stratospheric ozone over the Antarctic in
the SH spring each year is called the
Antarctic ozone
hole
.The areal extent of the ozone hole is commonly
greater than the size of North America.
Figure 11.10b shows the zonally and October-
averaged ozone column abundance versus latitude for
1979, 1999, 2005, and 2010. In 1999, the October aver-
age over the South Pole was 131 DUs, which compares
with 286 DUs in 1979, 141 DUs in 2005, and 150 DUs
in 2010. October ozone levels over 45
◦
S(thelatitude
of southern New Zealand, Chile, and Argentina) were
all 7 to 8 percent lower in 1999, 2005, and 2010 than in
1979. Ozone levels over 30
◦
S(thelatitude of Australia,
South Africa, Chile, Argentina, and southern Brazil)
were all about 3 percent lower during 1999, 2005, and
2010 than during 1979. Temporary losses of ozone over
these countries have caused concern due the effects
of the resulting enhanced UV-B radiation on health
(Section 11.9).
5
El Chichon
(April, 1982)
Mount Pinatubo
(June, 1991)
0
-5
-10
1980
1990
2000
2010
Year
Figure 11.8.
Percentage change in the monthly
averaged global (90
◦
Sto90
◦
N) ozone column
abundance between a given month through May
2011 and the same month in 1979. No data were
available from December 1994 to July 1996. Data
were obtained from the satellite-based Total Ozone
Mapping Spectrometer (TOMS) and made available
by NASA Goddard Space Flight Center, Greenbelt,
Maryland.
recovered. Because volcanic particles were responsi-
ble for only temporary ozone losses, the net ozone
loss over the globe from 1979 to 2011 was still about
5 percent.
11.4.3. Arctic Stratospheric Changes
Since 1979, the stratospheric ozone layer over the North
Pole has declined during the NH late winter and spring
(March-May). This reduction is called the
Arctic ozone
dent
.Figure 11.10a indicates that the Arctic ozone
dent in March has consistently been less severe than
has the corresponding springtime Antarctic ozone hole
during October. Figures 11.10a and 11.11, however,
show that ozone levels over the Arctic in March 2005
and 2011 were about 15 and 24 percent, respectively,
lower than were those in March 1979. Ozone levels
overthe Arctic in March 2010 were nearly the same as
those in March 1979. As discussed in Section 11.8.3,
the ozone dent occurs when temperatures in the Arctic
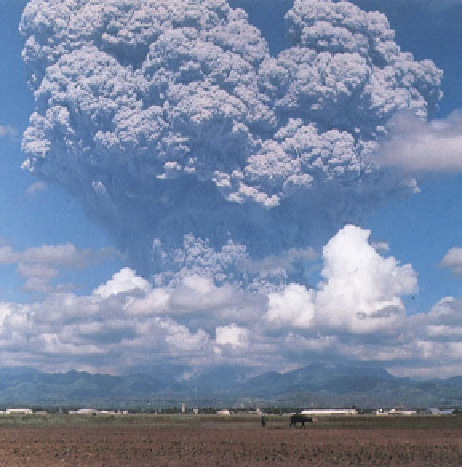
Figure 11.9.
Mount Pinatubo eruption, June 12, 1991.
Three days later, a larger eruption, the second largest
in the twentieth century, occurred. Photo by Dave
Harlow, USGS; http://pubs.usgs.gov/fs/1997/
fs113-97/.


Search WWH ::

Custom Search