Geoscience Reference
In-Depth Information
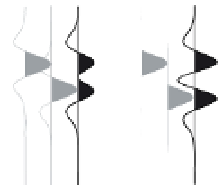
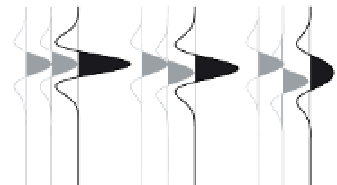
Single arrival Double arrival
Dominant
period
A B A+B
0.0
A B A+B
0.2
A B A+B
0.4
A B A+B
0.6
A B A+B
0.8
A B A+B
1.0
Time difference
(period)
Displacement
< 0.5 period
Displacement
> 0.5 period
Seismic wavelet
Figure 6.5
Summation of two identical
arrivals with different travel times. The
grey traces (A and B) show the two arrivals;
the black trace (A+B) is the observed trace,
being the sum of the two grey traces.
Dominant
period
6.3.3
Seismic attenuation
In homogenous material, where all raypaths are straight
lines, the Fresnel volume is an ellipsoid of revolution and
Fresnel zones are circles (
Fig. 6.4c
). The maximum diam-
eter of the Fresnel zone (D
Fresnel
), assuming the distance
between source and detector (L) is much greater than the
dominant wavelength of the seismic wavelet, is given by
the approximate expression:
A seismic source introduces a pulse of strain energy into
the Earth and the
finite amount of energy is shared
amongst the various types of seismic waves produced. As
the waves propagate into the subsurface they lose their
energy, causing their amplitudes to decrease and their
shapes to change. Two basic mechanisms are involved:
geometric spreading and absorption.
q
LV
p
L
p
LVP
Dom
D
Fresnel
≈
λ
¼
=
f
Dom
¼
ð
6
:
5
Þ
Dom
where f
Dom
is the dominant frequency and P
Dom
the dom-
inant period of the signal, V the velocity at which it travels
and
6.3.3.1
Geometric spreading
As seismic waves move away from their source, the
wavefronts expand and so increase their areas. The energy
in the waves is distributed over the increasingly larger
wavefronts, so the amplitudes of the waves progressively
decrease with time. This is known as geometric spreading.
Consider the effects of the hemispherical wavefront associ-
ated with a body wave originating near the surface of a
medium in which the seismic velocity is constant (
Fig. 6.4a
and
b
). The surface area of a hemisphere is 2
λ
Dom
the dominant wavelength. From this expression
it is clear that the ellipse is broader for longer paths and
longer wavelengths. Reducing the wavelength, i.e. increas-
ing the frequency, reduces the area of the Fresnel zones
(
Fig. 6.4d
). A ray (having no actual width) can be thought
of as representing a signal of in
nite frequency. In reality
the size of the Fresnel volume varies for each component
frequency of the seismic wavelet; representing the Fresnel
volume by the dominant frequency of the wavelet is an
approximation.
A useful working description of the Fresnel volume is
that it is the volume of material that is sampled by the
seismic wave on its journey through the subsurface to a
particular detector, and the characteristics of the wave,
when detected, are determined by the elastic properties of
the entire volume. Variations in the elastic properties
within the Fresnel volume are
R
2
body
, where
R
body
is its radius, i.e. the distance from source to wave-
front. In this case the energy per unit area of the wavefront
is linked to its radius by an inverse square (1/R
2
) relation-
ship. The amplitude of a wave is proportional to the square
root of its energy, so geometric spreading causes body-
wave amplitude to vary inversely proportional to R
body
,
i.e. a 1/R relationship. Geometric spreading changes the
amplitude, but not the shape, of a seismic wavelet as it
propagates through the medium (
Fig. 6.6a
). Note the very
rapid initial decrease in amplitude followed by a slower
decrease (the 1/R relationship).
The wavefront of a surface wave is circular on the
ground surface and extends to depth Z
surface
, i.e. it forms
π
and cannot be
separated from the volume as a whole. The dimensions of
the Fresnel volume and Fresnel zones are a measure of the
smallest resolvable feature in the subsurface (see
Section
'
averaged
'


Search WWH ::

Custom Search