Geoscience Reference
In-Depth Information
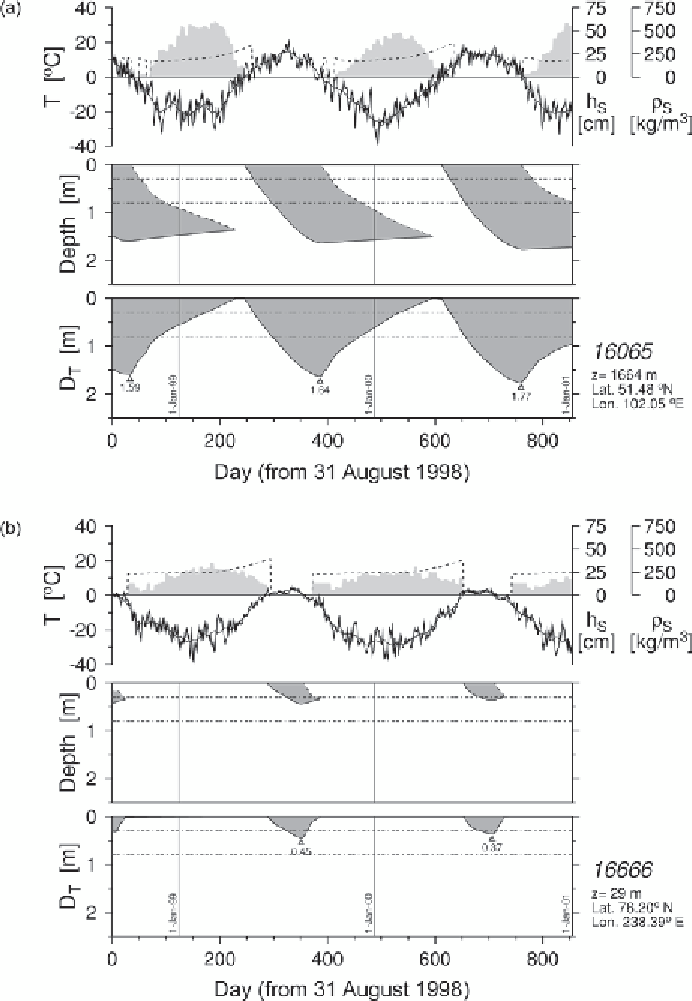
Figure 9.3.
Time series (August 31, 1998 to December 31, 2000) from an active
layer thickness model for model grid cells in (a) Siberia and (b) northern Canada. The
top panels for each location show surface air temperature (including a thirty-one-day
running mean), snow height h
s
(shaded), and snow density p
s
(thin dashed line). The
middle panels show the depth of the thawed layer (shaded regions), the development of
thawing planes (solid line), and freezing planes (dashed lines). The bottom panels show
the total thaw depth (with maximum values labeled). Also plotted on the middle and
bottom panels by horizontal dash-dotted lines are the boundaries of the major soil layers
at 0.3 and 0.8 m depth. Grid cell elevations z, latitude and longitude are also given (from
Oelke et al.,
2003
, by permission of AGU).