Geoscience Reference
In-Depth Information
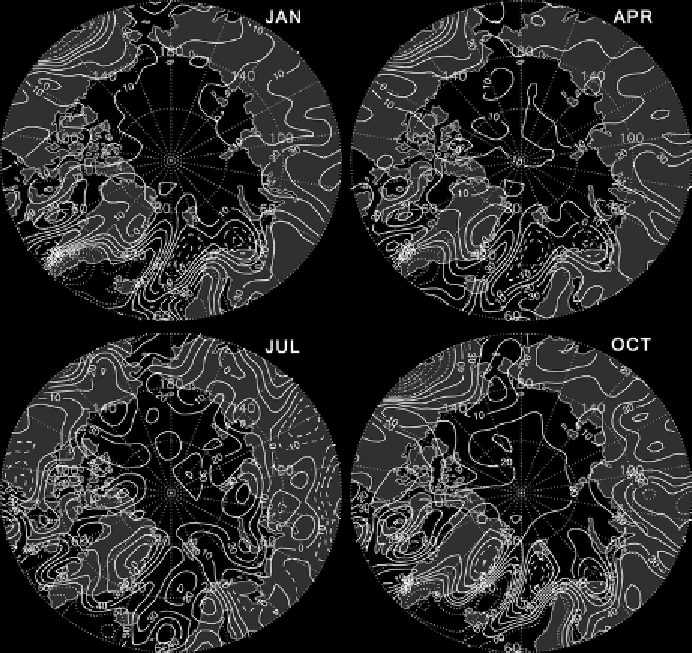
Figure 6.10.
Aerological estimates of mean precipitation minus evaporation (P-E) for
the four mid-season months based on NCEP/NCAR data for the 1970-1999 period.
Contours are at every 10 mm for amounts up to 50 mm (negative values dashed) and at
every 20 mm for amounts of 60 mm and higher (by the authors).
maximum and summer minimum. By comparison, P-ET over much of the land area
is at a minimum in summer, in rough antiphase with precipitation. Over Eurasia,
P-ET in June and July is negative over large areas. This manifests fairly high sum-
mer ET rates, as seen in the MERRA ET fields. We will return to this issue shortly.
The region of negative P-ET south of Svalbard is not present in the summer months.
The feature appears to be associated with strong evaporation in the cold months
associated with the contrast between open water and the cold, dry overlying atmo-
sphere (again see
Plate 6
). The impact of strong convective heating in this area on
the heat budget of the polar cap was examined in
Chapter 3
.
6.3
Hydrologic Impacts of the NAO and AO
Recall from
Chapter 4
that the North Atlantic Oscillation, or NAO, is an atmo-
spheric teleconnection characterized by covariation in the strength of the Icelandic