Geoscience Reference
In-Depth Information
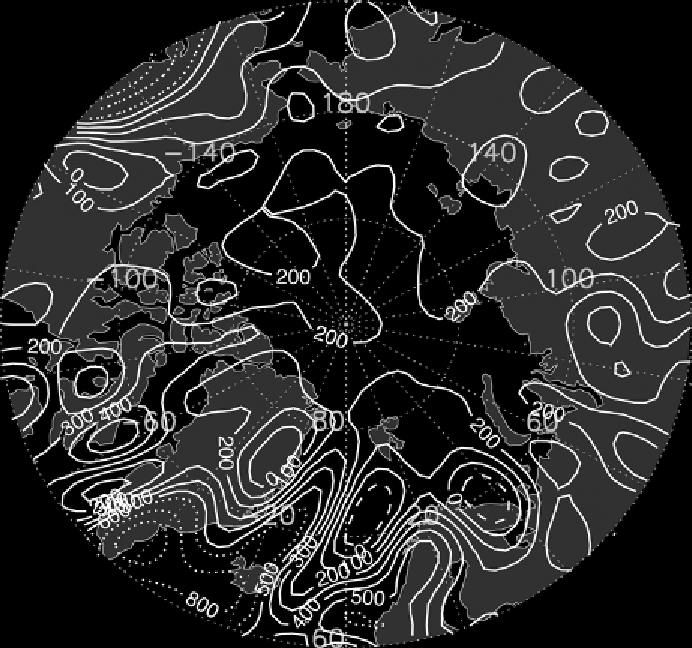
Figure 6.9.
Aerological estimates of mean annual precipitation minus evapotranspiration
(P-ET) based on NCEP/NCAR data for the 1970-1999 period. Contours are at every
100 mm up to 500 m (negative values dashed) and at every 200 mm for amounts of
600 mm and higher (by the authors).
of 70°N from the two models is very similar, with a value of 188 +/− 6 mm per year,
compared with the radiosonde-derived estimate of 163 mm per year.
The mean annual field of P-ET based on the NCEP/NCAR reanalysis over the
1970-1999 period is provided in
Figure 6.9
. Fields for the mid-season months
appear in
Figure 6.10
. The fields shown here are similar to those from other reanaly-
ses. Annual P-ET over the central Arctic Ocean is 200-300 mm, broadly similar to
annual precipitation. The implication is that annual ET is small in this region, which
is borne out clearly from the SHEBA results discussed earlier and from the MERRA
ET fields (
Figure 6.8
). A further implication is that estimates of precipitation over
the central Arctic Ocean can be obtained from the P-ET field in the absence of
surface observations. The annual excess of P over ET is greatest off the Greenland
coast and around Iceland as well southern Alaska where precipitation is high. Note
the area of negative P-ET south of Svalbard. Like the annual cycle in precipitation,
P-ET has a summer maximum and cold season minimum over the Arctic Ocean
while the areas off eastern Greenland and along southern Alaska have a cold season