Geoscience Reference
In-Depth Information
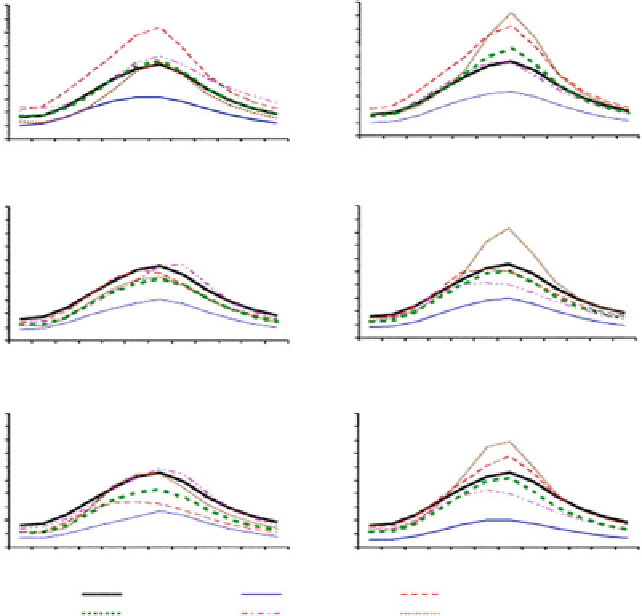
2020-50 A2 scenario
2020-50 B2 scenario
2500
2250
2000
1750
1500
1250
1000
750
500
250
0
2500
2250
2000
1750
1500
1250
1000
750
500
250
0
2050-80 A2 scenario
2050-80 B2 scenario
2500
2250
2000
1750
1500
1250
1000
750
500
250
0
2500
2250
2000
1750
1500
1250
1000
750
500
250
0
2070-99 A2 scenario
2070-99 B2 scenario
2500
2250
2000
1750
1500
1250
1000
750
500
250
0
2500
2250
2000
1750
1500
1250
1000
750
500
250
0
Baseline
All models
HadCM3
GFDL
CCC
CCSR
Fig. 17.2
Mean monthly flow at Mukwe with baseline simulations and with assessment of changes
of precipitation and evaporation derived from various GCMs, driven by the A2 and B2 greenhouse
gas emission scenarios (Adopted from
Andersson et al.
(
2006
))
Regularly Flooded (RF), Occasionally Flooded (OF), High Flooded Only (HFO)
and Dry Land (DL). The PF floodplain was further classified into Proper and Fringe
and hence denoted as PF1 and PF2 respectively and so is the case with RF—Annual
(RF1) and Biennial (RF2).
The future change simulated by the hydrological model using these GCMs is
shown as either 'wetter' or 'drier', which makes adaptation policy difficult. These
studies have also recognized the uncertainties in current GCM climate change
projections and the need to reduce these uncertainties followed by the need to
develop appropriate adaptation strategies for the use of water resources over the
Okavango River basin region.
It has been noted that changes in future precipitation may be more adequately
specified on the sub-basin scale by downscaling the coarse GCM data using
Regional Climate Models (RCMs) allowing for more detailed assessments of spatial
heterogeneities in climate change impacts on water resources since these are limited
area models run at a higher resolution compared to GCMs (
Andersson et al. 2006
).
Search WWH ::

Custom Search