Geoscience Reference
In-Depth Information
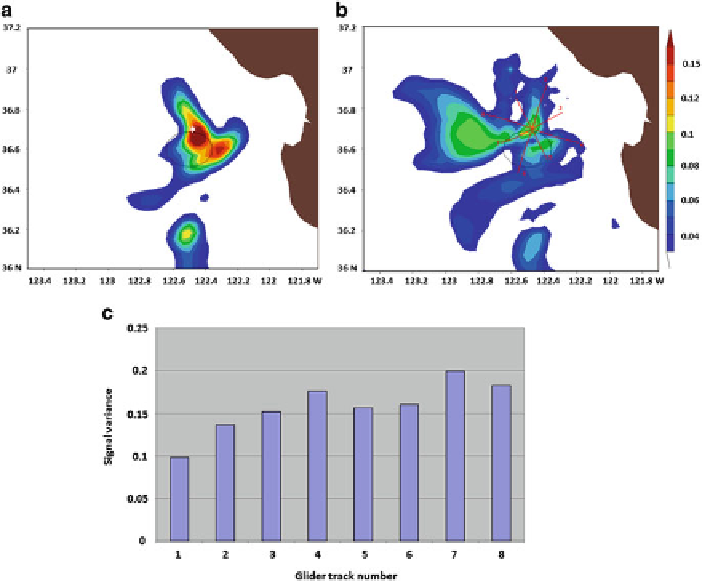
Fig. 16.7
(
a
) Signal variance at the verification time for the feasible deployment of adaptive
observations indicated by the white crosses, (
b
) Summary map of average signal variance over
the verification area at the verification time as a function of a single temperature observation, (
c
)
Bar chart of signal variance for eight glider tracks displayed in (
b
)
reduction in forecast error variance within the verification region at the verification
time as a function of each of the eight possible glider paths is plotted as a bar chart
(Fig.
16.7
c). Each bar gives the ETKF prediction of the reduction of forecast error
variance within the verification region to be associated with a particular glide track.
Given knowledge about where a glider is at the beginning of the targeting time,
these bar charts can be used to direct the glider along the path predicted to have the
maximum impact on the forecast error reduction. Thus, the signal variance given on
the bar chart suggests that track seven is the best of these eight glider deployments.
During the AOSN II field campaign, up to 15 different gliders are crisscrossing
the Monterey Bay at any given time. For example, thirteen gliders are deployed
on Aug 13, 2003 during a 24 h observation time window and each takes the path
indicated in Fig.
16.8
a. As a test of a target technique, it is of a great interest to see
which of these 13 glider paths would have been the best choice if one were only
going to assimilate observations from just one of the 13 gliders. Figure
16.8
bgives
the ETKF predicted reduction in forecast error variance in the verification region at
Search WWH ::

Custom Search