Geoscience Reference
In-Depth Information
122:5
ı
Wfor(
a
) targeting
time 00 UTC 13 Aug 2003 and (
b
) verification time 00 UTC 14 Aug 2003. Signal variance for
nine observations centered at
36:7
ı
N,
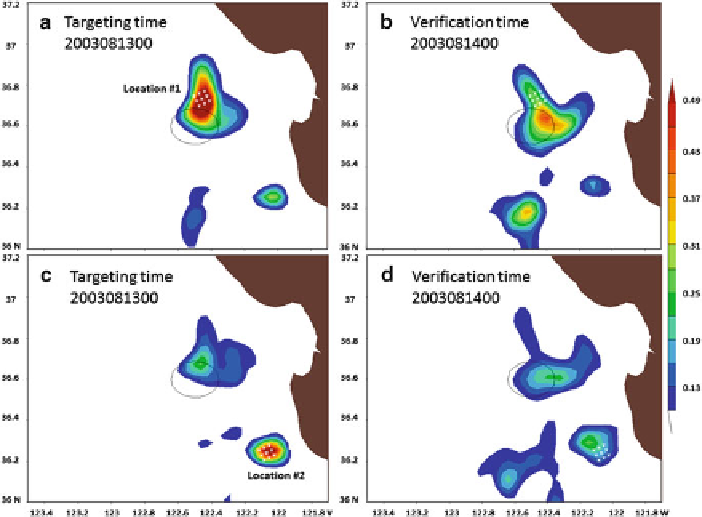
Fig. 16.6
Signal variance for nine observations centered at
122:1
ı
Wfor(
c
) targeting time same as (
a
) and verification
time same as (
b
). The black ellipse contour indicates verification region
36:2
ı
N,
the targeting time. It shows larger signal variances at the location #1 (Fig.
16.6
a)
compared to the location #2 (Fig.
16.6
c) due to larger ensemble spread at the
targeting time. The signal variance at the verification time has larger values within
the verification region from the location #1 (Fig.
16.6
b) compared to the location
#2 (Fig.
16.6
d). This suggests the first location for the deployment is more likely to
improve the forecast than the second location.
Figure
16.7
a depicts the predicted reduction in forecast error variance at the
verification time due to a surface temperature observation at the targeting time at the
location indicated by the white cross. By integrating this field across the verification
region we obtain a prediction of the reduction in forecast error variance due to an
observation at the white cross. Figure
16.7
b plots the mean reduction in forecast
error variance as a function of the location of the test observation. We refer to maps
like Fig.
16.7
b as a “summary map”.
If gliders are available for adaptive sampling, summary bar charts can be used to
choose among several feasible glider paths. At a particular location, a glider needs
to be directed which direction it will be towards to. To demonstrate how signal
variance summary bar chart can be used, assuming that for a particular location,
a glider can have eight possible tracks (red lines in Fig.
16.7
b). The predicted
Search WWH ::

Custom Search