Geoscience Reference
In-Depth Information
(
a)
(
b)
(c)
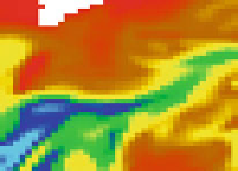
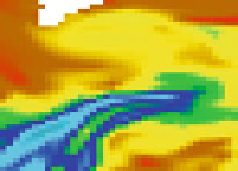
Fig. 8 Specific humidity (q) fields at 850 hPa associated with the highest 3-day precipitation total for grid
boxes within the UK region (7W-3E, 50-60N) during the winter-half year (October-March) for
a HadGEM2-A AMIP simulations (1995-2008) and HadGEM2-ES RCP8.5 simulations over the periods
b 2006-2019 and c 2085-2098
negative relationship between P and T over land (Gu et al.
2007
; Liu et al.
2012
). The
climate change responses are consistent with an intensification of P at high percentiles,
close to the water vapor responses of around 6 %/K, and reduced P for the dry regions
(sub-tropical anticyclonic regimes) of net moisture export (e.g., Allan
2012
), consistent
with Fig.
6
.
3.4 Influence of Dynamical Changes on Precipitation and Its Extremes
At finer time and space scales, it is less clear what the precise response of extreme
precipitation to warming will be (Haerter et al.
2010
). While the Clausius-Clapeyron
relation provides a broad constraint, additional local latent heating may invigorate storms
leading to a super-Clausius-Clapeyron scaling (Lenderink et al.
2011
) while moisture
limitation and atmospheric stabilization associated with latent heating at larger scales may
result in responses below that anticipated from Clausius-Clapeyron (Haerter et al.
2010
).
Knowledge of the precise time and space scales associated with the most damaging
flooding events is therefore crucial.
Changes in updraft velocity strongly influence the simulated P
99.9 %
response in the
tropics (Turner and Slingo
2009
; O'Gorman and Schneider
2009
; Allan et al.
2010
); the
heaviest rainfall events are reliant on parametrized processes operating below the model
grid scale. At higher latitudes, where large-scale processes become dominant in explaining
intense precipitation, the simulated responses show greater consistency (O'Gorman and
Schneider
2009
) although there is evidence that they underestimate the observed responses
(Min et al.
2011
). In the UK, peak river flows during the winter-half of the year have been
found to be associated with Atmospheric Rivers (Lavers et al.
2011
). These are long
(*1,000 km), narrow (*100 km) regions of strong water vapor transport in the warm
sector of extra-tropical cyclones that can result in intense rainfall when the moisture is
condensed,
in
particular
following
the
uplift
of
the
moisture-laden
air-masses
over
mountains (e.g., Dettinger et al.
2011
).
Atmospheric reanalyses, such as ERA Interim, and current climate models are typically
able to resolve the large-scale processes associated with these flood-inducing events.
Figure
8
illustrates the specific humidity (q) structure associated with 14-year maximum
3-day P totals for grid points around the UK for present-day simulations and future projec-
tions. The present-day simulations are indeed associated with Atmospheric River structures.
The future projection in Fig.
8
c simulates greater amounts of water vapor, consistent with