Geoscience Reference
In-Depth Information
Ocean + Land
Ocean
Land
10
25
25
20
20
0
15
15
−10
10
10
5
5
−20
0
0
−5
−5
−30
GPCP 1DD
SSM/I F13
AMIP
CMIP
RCP 4.5
−10
−10
−40
−15
−15
−20
(a)
−20
(b)
(c)
−50
−25
−25
10
25
25
20
20
0
15
15
−10
10
10
5
5
−20
0
0
−5
−5
−30
−10
−10
−40
−15
−15
(d)
(e)
(f)
−20
−20
−50
−25
−25
60 75 82 85 88 91 94 97 100
60 75 82 85 88 91 94 97 100
60 75 82 85 88 91 94 97 100
Precipitation Percentile (%)
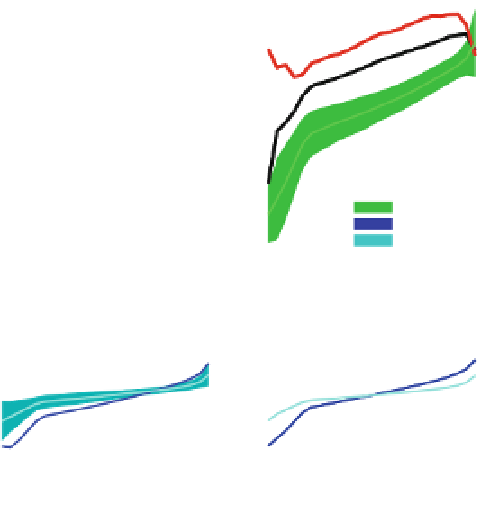
Fig. 7 Percentage responses of 5-day mean P to changes in tropical (30S-30N) mean T as a function of
P intensity percentiles in the present day (1998-2008, linear regression) for a the tropics, b tropical ocean
and c tropical land for AMIP5, GPCP 1DD and SSM/I and for the present and future in CMIP5 models
(historical 1985-2005 using linear regression) and RCP4.5 minus historical (2080-2100 minus 1985-2005
using differences in mean intensity distribution) for the d tropics, e tropical ocean and f tropical land. In all
cases, tropical (land and ocean) mean T is used. Shaded areas denotes ±1 standard deviation of inter-model
spread; vertical bars denote ±1 standard error in the linear regression for GPCP and SSM/I. Models 1-10 in
Table
2
are used
The climate change response of 5-day P extremes is compared with present-day sim-
ulations from the historical experiments in Fig.
7
d-f. Consistent with the AMIP5 simu-
lations and observations, there is a tendency for the wet percentiles to become wetter
during warm months, while the dry percentiles become drier (Fig.
7
d). Statistical uncer-
tainty is large for P
i\60 %
over land (Fig.
7
f), a likely result of the small and zero P totals in
this bin. The tropic-wide percentile responses in Fig.
7
d are dominated by the ocean
regions (Fig.
7
e). However, the climate change response (calculated as a percentile dis-
tribution difference between 2080 and 2099 RCP4.5 minus 1985-2005 historical simu-
lations) displays a more modest response compared with the present-day linear regression
applied to CMIP5 historical simulations (which are only slightly weaker than the AMIP5
simulations and observed relationships). The climate change response indicates a P
99%
response of *6 %/K, close to that expected from the Clausius-Clapeyron relation.
For land regions, the climate change response of P
i
to warming is more positive than the
present-day CMIP5 relationships (Fig.
7
f) with P
99%
responses out to 2080-2100 again
close to that anticipated from Clausius-Clapeyron scaling. Thus, relationships derived
from present-day variability are not good proxies for the climate change responses, in
particular for the land regions. This is because ENSO variability enhances ocean P sensi-
tivity to warming and cooling, due to changing rainfall patterns, while it introduces a