Geoscience Reference
In-Depth Information
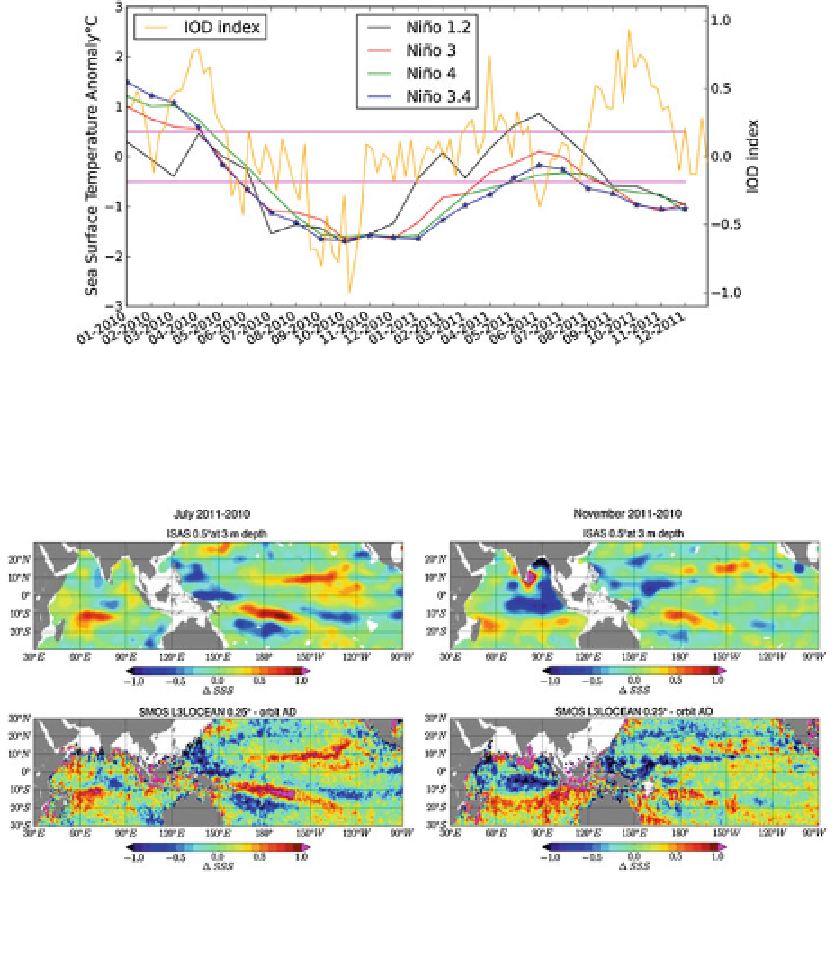
Fig. 19 Time series of SST anomalies in the four Ni˜ o regions from
http://www.cpc.ncep.noaa.gov/data/
indices/sstoi.indices
in 2010-2011 and corresponding Indian Ocean Dipole (IOD) Index (SST difference
between eastern and western equatorial Indian Ocean) from the Australian bureau of Meteorology (BOM)
Fig. 20 Differences in the monthly averaged SSS between year 2011 and 2010 for months of July (left) and
November (right). Top panels show the DSSS = SSS
2011
- SSS
2010
results obtained from in situ OI
analysis products ISAS and bottom ones from SMOS data
The differences in rain rate as derived from SSM/I F17 sensor between 2011 and 2010
for several selected months as shown in Fig.
21
further demonstrate that part of the
observed SSS interannual variability for July and November is associated with large
precipitations anomalies during previous months, associated with displacements of the
ITCZ and of the South Pacific Convergence Zone. In the Indian Ocean, SSS differences
DSSS = SSS
2011
- SSS
2010
observed in November indicate saltier SSS in 2010 than in
2011 in the eastern equatorial Indian Ocean within the band [10-0S; 70-95E] asso-
ciated with a smaller rain rate (RR
2010
\ RR
2011
) in the surrounding region during pre-
ceding months, as evidenced by the rain rate difference on the October and November
maps shown in Fig.
21
. Between *10S and 20S, SSS are fresher in 2010 than in 2011;
this is associated with higher precipitation in 2010 than in 2011(RR
2011
\ RR
2010
) in the