Geoscience Reference
In-Depth Information
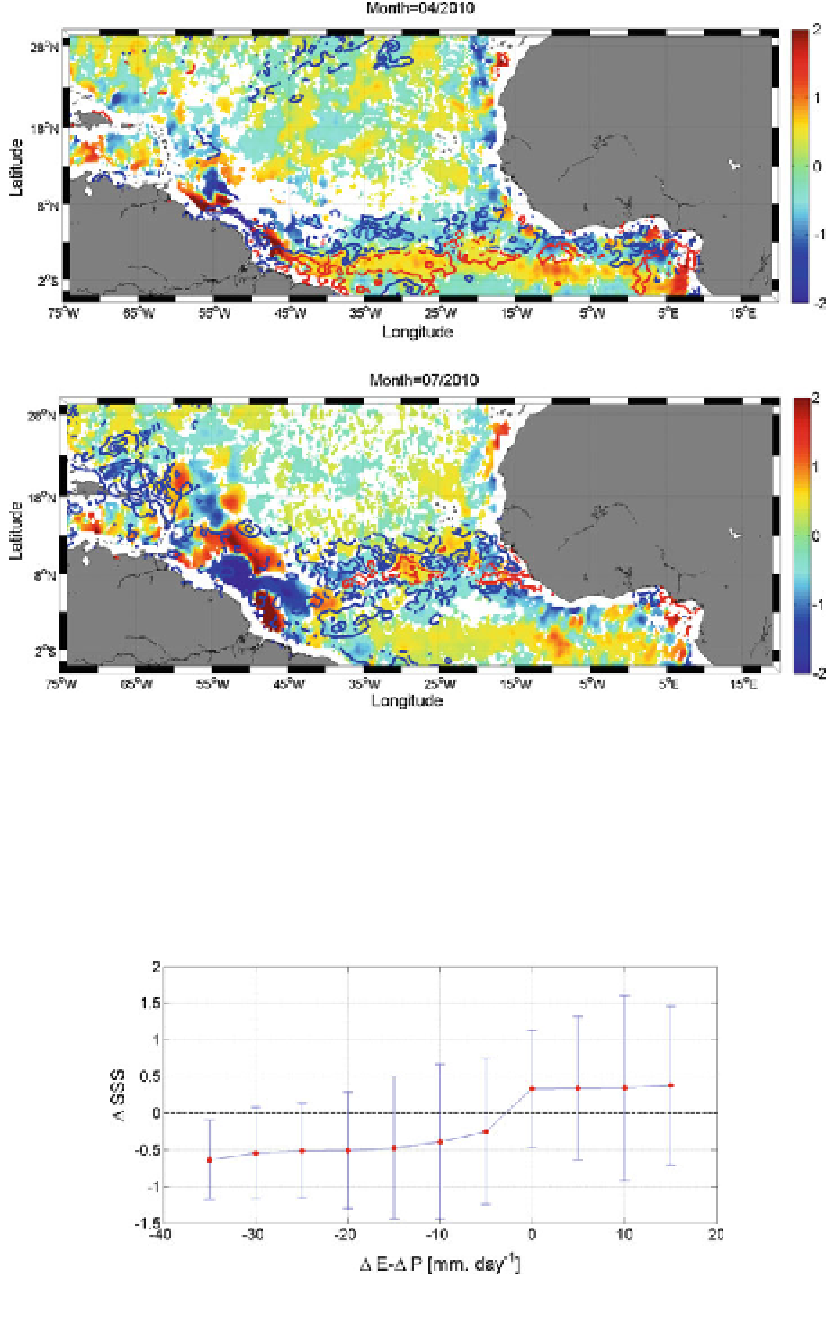
Fig. 17 Maps of the monthly averaged large-amplitude SSS anomalies deduced from SMOS data for 2
selected months of 2010 (Top: month of March 2010. Bottom: month of July 2010). The threshold value
used to derive the anomaly is defined by 1 r
S
, the local standard deviation of SMOS anomaly. Superimposed
are the contours of the large positive amplitude precipitation anomalies (blue) and positive evaporation
anomalies (red)
Fig. 18 Average relationship between SMOS SSS anomalies and the net atmospheric freshwater flux
anomalies DE-DP in the tropical Atlantic (defined here by 5S-20N;75W-15E) over year 2010