Geoscience Reference
In-Depth Information
1.4
1.2
1.0
0.8
0.6
0.4
0.2
0.0
1900
1920
1940
1960
1980
2000
2020
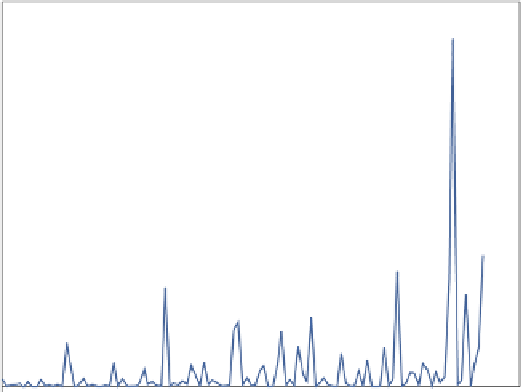
Figure 18.
Normalized costs of hurricanes for the United States, 1900-2012. This
fi gure shows the ratio of damages to GDP for all hurricanes for the given year.
Damages are highly skewed, with high damages in a few years, but little or no
damages in most years.
The effect of global warming on tropical cyclones has been studied
carefully, and the basic physics is clear. Global warming may affect sev-
eral dimensions of hurricanes, including frequency, size, intensity, du-
ration, and geographic distribution. Of the fi ve, the only clear link from
basic physics is between global warming and intensity. As sea surface
temperature rises, the “potential intensity” or upper limit of wind speed
increases, holding other factors constant. Recent calculations suggest
that a warming of 4°C would increase the average intensity by about
one category (say, from a category 2 to a category 3 hurricane, or about
16 miles per hour).
A further question is whether other extreme storm events, such as
tornadoes or thunderstorms, are likely to increase in frequency or inten-
sity. The answers here are less clear than for hurricanes because the
underlying causes (unlike the effects of warmer water on hurricanes) do