Geoscience Reference
In-Depth Information
an
equivalent projection
, which accurately portrays size features
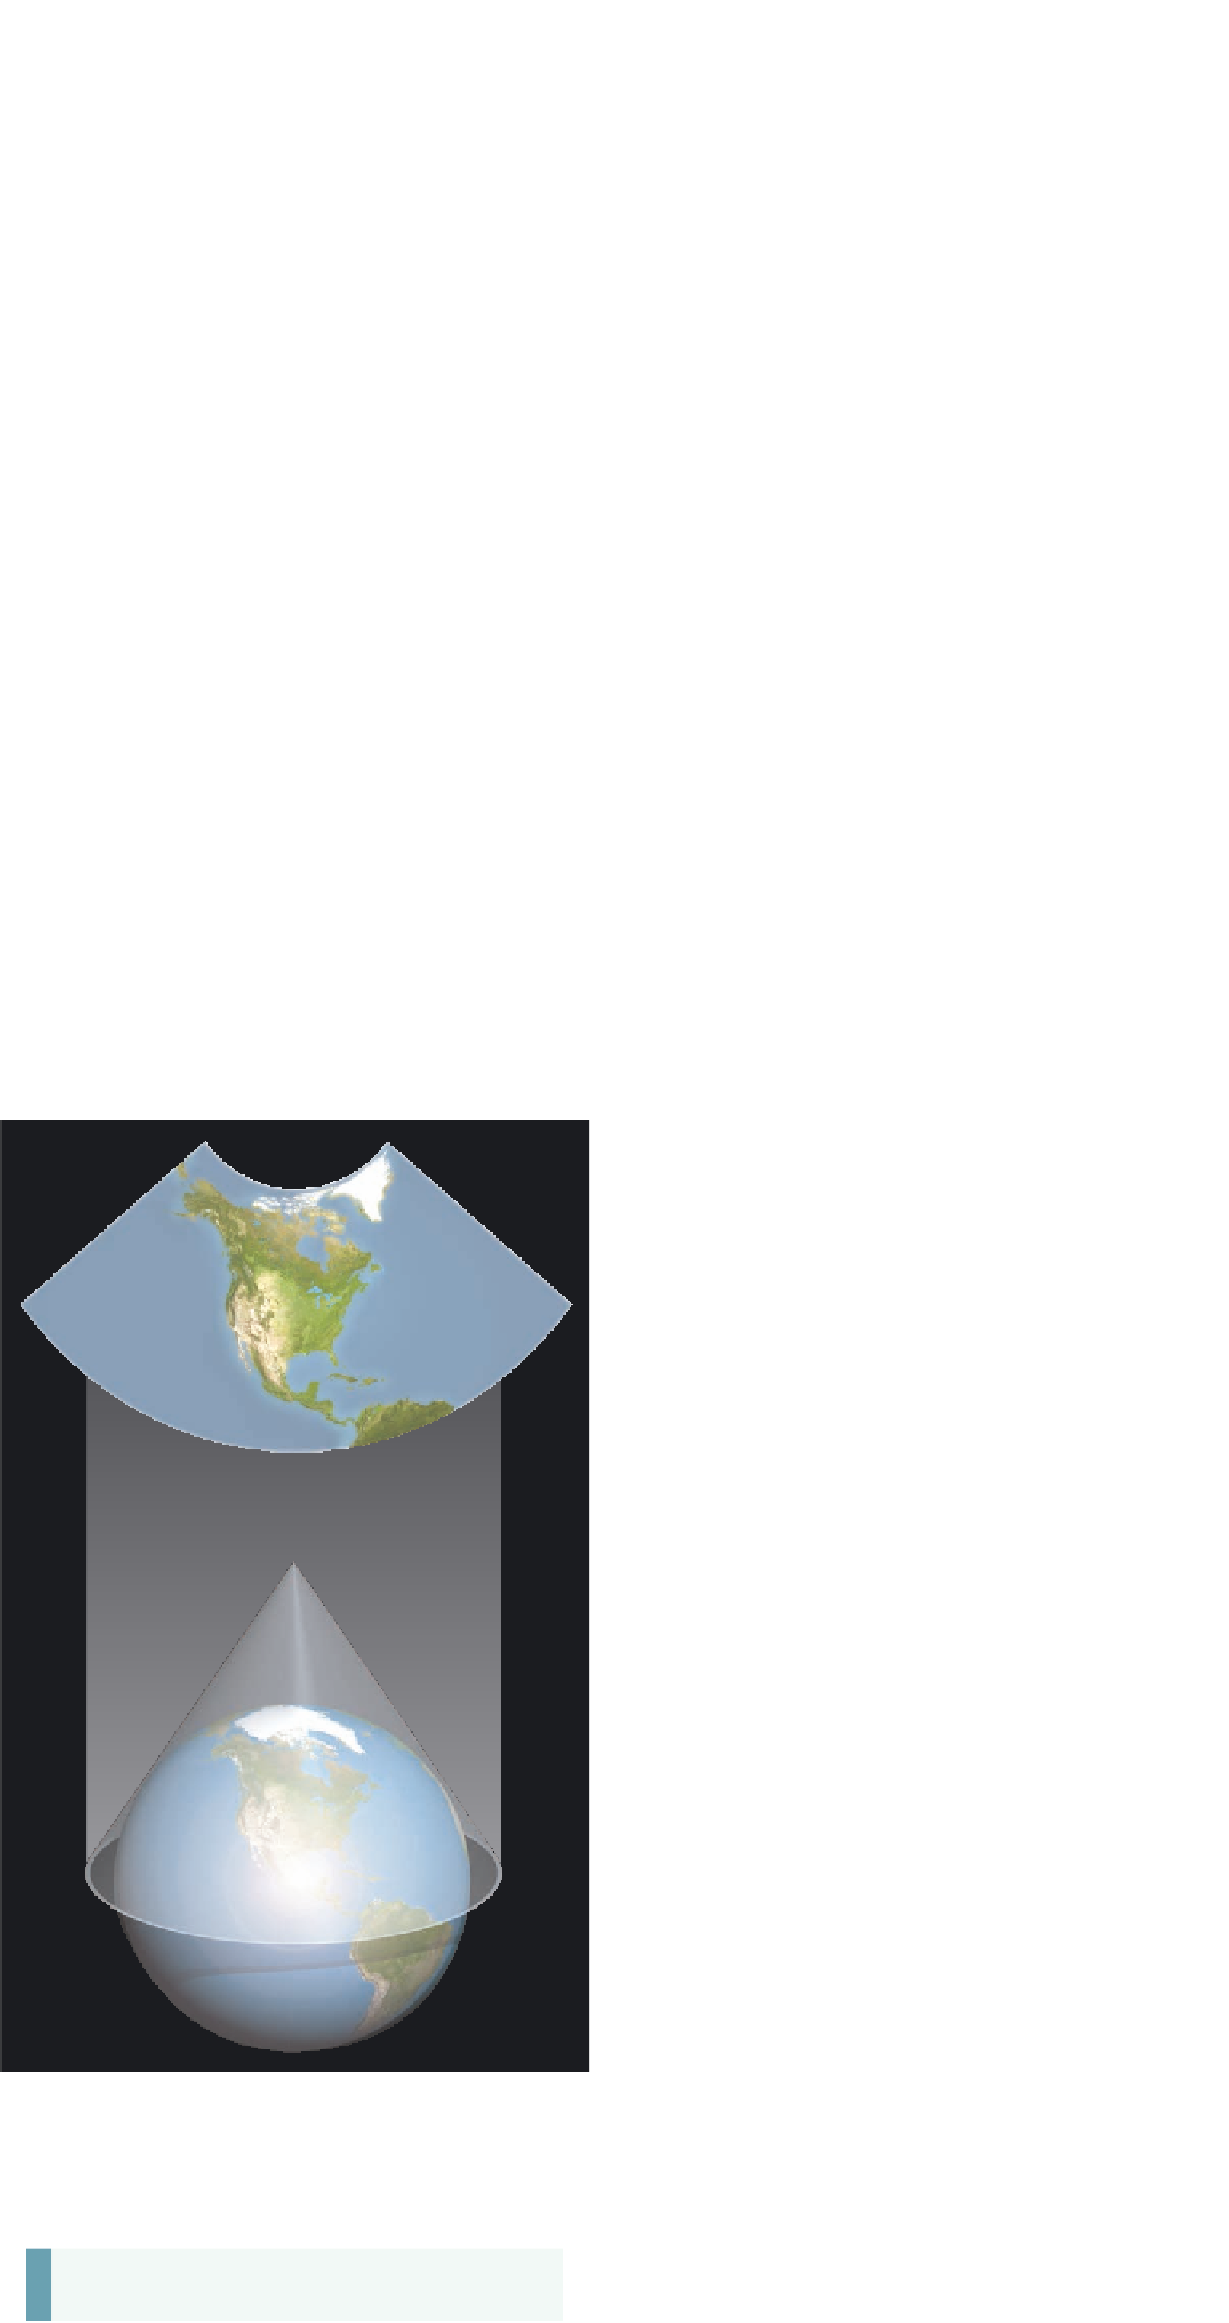
throughout the map. This map can be theoretically constructed by
placing a cone over a portion of Earth, with the sharp point over
the North Pole (Figure 2.16). In this instance light is projected
upward through the cone, which is then laid flat to form the map.
One kind of equivalent projection that results from this pro-
jection process is an Albers equal-area projection (Figure 2.16),
which was developed in 1805 by the German geographer H. C.
Albers. Notice how this map, which focuses on North America,
compares with the Mercator projection in Figure 2.15. One
primary difference is that the lines of latitude are now curved.
Given that these particular lines are actually curved on Earth,
this kind of map represents a more accurate presentation of the
geographic grid than a Mercator projection.
Another difference lies in the respective shapes of land-
masses, which can be nicely seen again at Greenland. Remem-
ber that in the Mercator projection (Figure 2.15), the shape of
Greenland was accurately portrayed but the size was distorted.
How does Greenland now look in Figure 2.16? Notice that
Greenland looks squat in the Albers projection compared to the
Mercator projection. Why does this difference exist? Remember
that a map projection can preserve only one spatial variable at a
time. In the case of the Albers projection, the shape of places at
high latitudes is distorted so that the relative size of places can
be more accurately observed.
You might ask, why does it matter whether or not the sizes
of landmasses on Earth on a map are accurate? Remember that
the Mercator projection, because it preserves shape, allows you
to compare features such as the configuration of coastlines.
However, would a Mercator projection provide an accurate
comparison of the
length
of
coastline between the United States
and Greenland? The answer to this question is “no” because
the size of continents at high latitudes is severely distorted by
a conformal projection. Thus, the only way to compare accu-
rately the length of coastline between Greenland and the United
States would be to use an equivalent-area projection.
It is important to emphasize that many different kinds of
projections exist, although it is beyond the scope of this text
to describe each of them. Depending on the kind of informa-
tion you want to see, a projection exists for that purpose. Some
projections intensively exaggerate the distortion of one prop-
erty in order to represent another more accurately. Others at-
tempt to show all spatial information as accurately as possible,
given the limitations of the technique, and therefore moderate
the distortion of both shape and size. A good example of such
a projection is the Robinson projection (Figure 2.17), which
was developed in 1963 by the American cartographer Arthur
H. Robinson. Notice how this particular projection seems to
be evenly balanced relative to the Mercator (Figure 2.15) and
Albers (Figure 2.16) projections. Greenland and Antarctica are
still somewhat enlarged relative to their accurate size, but some
semblance of the Earth's curvature exists.
Greenland
Projection of globe
onto flat wall
Conical
surface
Light source
at center
of globe
Figure 2.16 Constructing an equivalent projection.
The
resulting map in this diagram is a specific kind of equivalent
projection called an Albers equal-area projection.
KEY CONCEPTS TO REMEMBER ABOUT
MAP PROJECTIONS
1.
Map projection is a critical part of cartography because
it allows the three-dimensional Earth to be represented
in two dimensions.
2.
A map projection is designed to preserve either the
shape or size of geographic features.
Equivalent projection
A map projection that accurately por-
trays size features throughout the map.
3.
Conformal projections maintain the angular relationship
between geographic features, but distort the relative size.