Geoscience Reference
In-Depth Information
Greenland
Antarctica
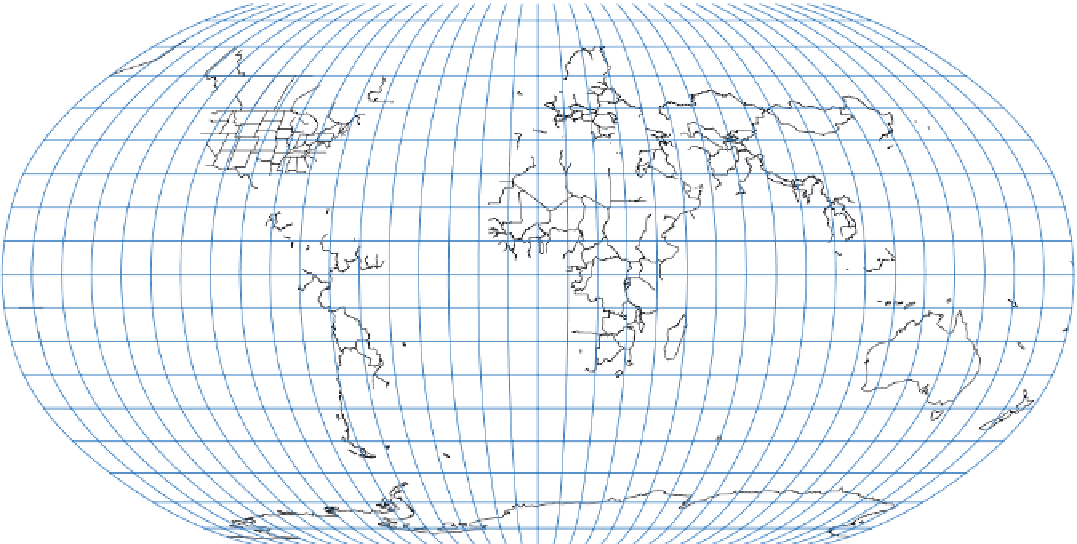
Figure 2.17 The Robinson projection.
In an effort to balance the errors associated with projection, this map contains distortion
in both shape and size.
4.
Equivalent projections maintain the relative size of geo-
graphic features at the expense of shape.
of the same unit on the ground. It does not matter what unit
of measurement is used—it could be inches, centimeters,
etc.—but the units must be the same within the ratio (inches
to inches, centimeters to centimeters, etc.).
3.
Graphic Scale or Bar Scale
. These scales show the actual
size of units on the map. The advantage of the graphic (or
bar) scale is that the scale remains accurate if the map is
enlarged or reduced when photocopying.
5.
Several different kinds of projections are used by car-
tographers, each of which is designed to portray size
and shape in a specific way.
Map Scale
Aside from understanding how the concept of map projection
works, another important consideration involving map interpre-
tation is the scale. Map scale is a critical part of cartography be-
cause it relates the size of features on a map to their actual size
in the real world. Similarly, the scale relates the distance be-
tween features on the map to the corresponding actual distances
on Earth. In other words,
map scale
represents the ratio of the
size/distance on the map to the size/distance on the ground.
Map scale can be depicted in several ways.
Maps are made at different scales depending on the geo-
graphic qualities they are designed to display, including the
area they cover and spatial detail. In general terms, geogra-
phers think of maps in terms of being large scale or small scale.
Although these designations appear easy to differentiate, the
fact is that many nongeographers find them confusing because
an inverse relationship exists between map scale and actual
Earth features. You might think, for example, that a large-scale
map is a map that shows a large part of Earth. Conversely, a
small-scale map would be a map that focuses on an area of
limited geographic extent, such as a city or park. The fact is
that
small-scale maps
are maps that show large areas with
relatively limited detail because the representative fraction is
a small number; in other words, the size ratio of the map
features to the real world is small.
Large-scale maps
, in
1.
Written (Verbal) Scale
. Often written as: One Inch =
2000 Feet, which means that 1 in. measured on the map
represents 2000 ft on Earth.
2.
Representative Fraction
. An example of a representative
fraction is the ratio 1:24,000 or 1/24,000. This scale means
that one unit of measurement on the map represents 24,000
Map scale
The distance ratio that exists between features on
a map and the real world.
Small-scale map
A map that shows a relatively large
geographic area with a relatively low level of detail.
Large-scale map
A map that shows a relatively small
geographic area with a relatively high level of detail.