Geoscience Reference
In-Depth Information
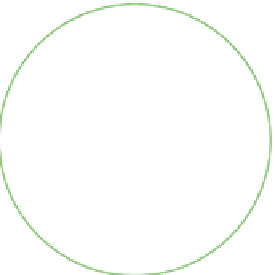
Figure 13.19 Seismic triangulation.
The epi-
center of an earthquake is the point where the
distance
measurements
from
three
seismic
observation stations overlap.
Epicenter
B
C
500
km
2000 km
A
Given the known speed difference between P waves and
S waves, it is possible to calculate the distance to an earthquake
epicenter at any observation station by noting the time lag between
the passing of each wave. When the passing of seismic waves is
viewed in a regional context, it is logical to assume that a wave
will require more time to reach an observation station that is farther
away from the epicenter than one that is closer. With these time
patterns in mind, geologists can determine the earthquake epicen-
ter by triangulating the time lag between three separate observation
stations. The epicenter is located at the point where the respective
distance measurements overlap (Figure 13.19).
Yet a third kind of wave is a surface wave, which moves only
through the upper crust. Although
surface waves
move much more
slowly than the P and S waves within Earth, and actually arrive after
the two body waves, they are responsible for most of the damage
associated with an earthquake.
the crust and on the Earth's surface. This deformation is usually
associated with the various kinds of faults that occur when
opposing rock bodies move relative to each other in association
with plate tectonics (Figure 13.21).
One type of fault is a
normal fault
, which is a vertical
fault in which one slab of the rock is displaced up and the other
slab down (Figures 13.21a and 13.22). This kind of fault is
created by tension forces acting in opposite directions. Where
such faults occur, the opposing blocks are pulled away from
one another by gravity, which causes one of the fault blocks to
100 times stronger
10 times
stronger
Measuring Earthquake Magnitude
The strength of earth-
quakes is measured on the
Richter scale
, which is related to the
amplitude of seismic waves moving through the Earth's crust as de-
termined by a seismograph. The Richter scale is logarithmic and is
represented by whole numbers and decimal fractions. An increase of
one magnitude unit (such as 4 to 5) corresponds to 10 times greater
ground motion; an increase of two magnitude units corresponds to
100 times greater ground motion; and so on (Figure 13.20). The
magnitudes of earthquakes range between 0 (weakest) and 9 (stron-
gest) on the Richter scale. The actual ground motion for, say, a
magnitude 5 earthquake is about 0.04 mm (0.001 in) at a distance
of 100 km (62 mi) from the epicenter; it is 1.1 mm (0.04 in) at a
distance of 10 km (6.2 mi) from the epicenter.
Richter
magnitude
1
Richter
magnitude
2
Richter
magnitude
3
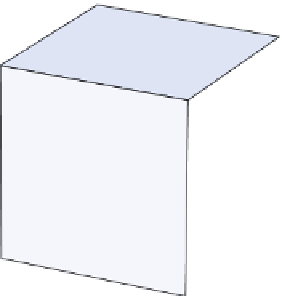
Figure 13.20 The Richter scale.
These cubes show the loga-
rithmic nature of the Richter scale, with the size of each cube rep-
resenting relative power. For example, a magnitude 2 earthquake
is 10 times stronger than a magnitude 1 earthquake. Similarly, a
magnitude 3 earthquake is 100 times stronger than a magnitude
1 earthquake.
Types of Faults
In addition to the production of seismic
waves, earthquakes cause deformation of the rocks both within
Richter scale
The logarithmic scale used to measure the
strength of an earthquake.
Normal fault
A steeply inclined fault in which the hanging
rock block moves relatively downward.