Geoscience Reference
In-Depth Information
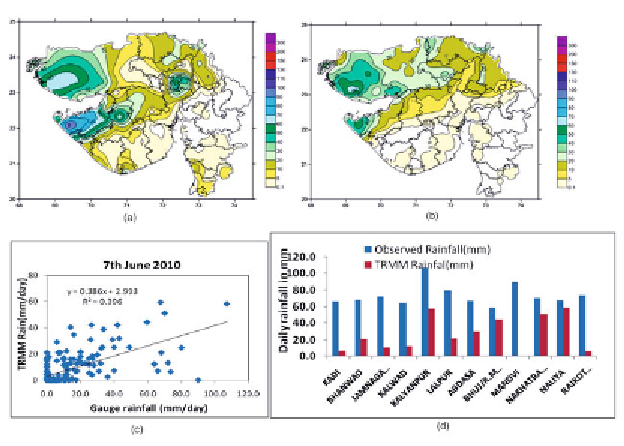
it is clearly seen that the spatial distribution of rainfall is well captured by
TRMM 3B42 daily rainfall data where as the intensity is underestimated as
compared to the observed daily rainfall data. The scatter-plot (Fig. 2c) shows
positive correlation (nearly 0.4) between gauge daily rainfall and TRMM 3B42-
V6 estimates. The low slope value suggests that the higher rainfall values are
underestimated. The scattered is more for the observed values greater than 30
mm/day. It indicates that the moderate value is well captured by TRMM rainfall
estimate. Inter-comparison of heavy rainfall more than 6.5 cm per day reported
by stations with TRMM daily rainfall estimate is done and results are shown in
Fig. 2d. The correlation is positive but poor (nearly 0.12) in case of higher
rainfall values (>6.5 cm).
Figure 3 shows the upper level strong divergence, lower level strong
vorticity, and upper level (200 hPa) anti-cyclonic winds over northeast Arabian
Sea and adjoining Pakistan and Gujarat on 6
th
June 2010. An anti-cyclonic
circulation lay over south Gujarat and adjoining areas favouring northeastward
movement of the TC across south Pakistan and Rajasthan. There was penetration
of dry mid-latitude westerlies in middle and upper tropospheric levels, which
helped in intense thunderstorm activity over the region on 6
th
and 7
th
June. The
moderate to high vertical wind shear also favoured the thunderstorm activity
in association with TC Phet. The frictional convergence due to land interaction
over the desert area of Pakistan, Kutch area of Gujarat and Thar Desert area of
Rajasthan was also another factor for intensive thunderstorm activity leading
Fig. 2:
Observed and TRMM rainfall over Gujarat State on 7
th
June 2010: (a) Observed
daily rainfall, (b) Daily TRMM 3B42-V6 estimates, (c) Scatter plot of daily observed
vs TRMM 3B42-V6 estimates and (d) Bar of observed heavy rainfall with the TRMM
daily rainfall estimates.
Search WWH ::

Custom Search