Geoscience Reference
In-Depth Information
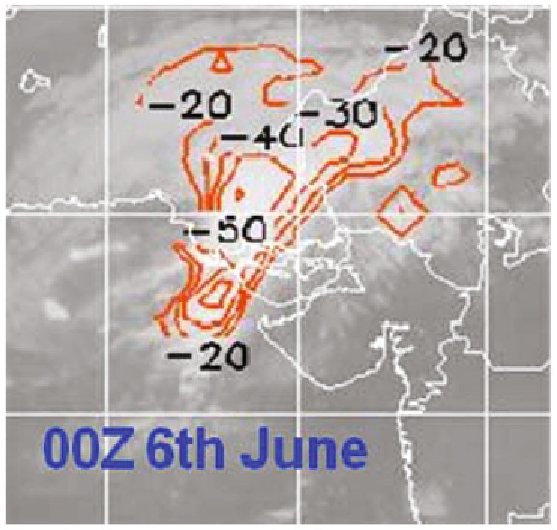
Fig. 3:
Contours of cloud top temperature at 00Z of 6
th
June 2010.
to heavy rainfall. In association with above flow pattern, the convection was
also organized in the southwest to northeast direction across Pakistan and
Rajasthan in the morning of 6
th
June. Gradually it moved eastwards covering
more area of Rajasthan and Kutch on 7
th
June while keeping the same southwest-
northeast orientation. Figure 4 shows the contour plots of cloud top temperature
(CTT) at 00 UTC during the period from 1
st
June to 6
th
June 2010. The contour
plot of CTT can be used for short-term qualitative prediction of heavy rainfall,
based on location, orientation and intensity of convection.
3.2 Heavy Rainfall over Rajasthan
Rajasthan received fairly widespread rainfall with isolated heavy rains on 6
th
and 7
th
June 2010 due to the cyclone Phet. It is observed that west Rajasthan
received 17 percent of normal seasonal rainfall whereas the Rajasthan state
received 6.5 percent of normal seasonal rainfall. Figure 5 shows the inter-
comparison of observed rainfall and TRMM 3B42 daily rainfall over Rajasthan
on 7
th
June 2010. From Fig. 5a and Fig. 5b, it is clearly seen that the TRMM
3B42 daily rainfall data is over-estimated as compared to the observed daily
rainfall data. The scatter-plots in Fig. 5c show positive correlation (nearly 0.5)
between gauge daily rainfall and TRMM 3B42-V6 estimates. The high slope
value suggests the higher rainfall values overestimated. The scattered is more
Search WWH ::

Custom Search