Geoscience Reference
In-Depth Information
Table 2:
Vector displacement errors (VDEs) at different forecast time
Date (forecast hrs)(Day_hour)
CNTL
GTS
RAD
26_00 (00 hrs)
140
72
64
27_00 (24 hrs)
135
127
122
28_00 (48 hrs)
131
116
77
29_00 (72 hrs)
318
201
26
30_00 (96 hrs)
525
339
179
experiment after assimilation of radiance along with GTS observation as
compared to the other two simulations.
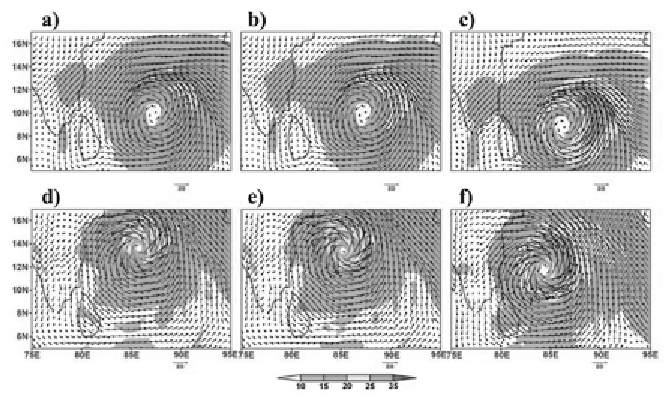
The model initial time and day 2 (valid at 00 UTC 28 December 2011)
wind field at 850 hPa from the three experiments are shown in Fig. 3 (a-c) and
(d-f) respectively. It is clear that the close circulation around the storm is
simulated well in all experiments; however, the RAD simulations show stronger
wind as compared to the CNTL and GTS simulation at model initial time
as well as day 2 forecast. At model initial time the wind is stronger around
10 m/s in the RAD analysis as compared to CNTL and GTS simulations.
Similarly, in day 2 forecast the wind is stronger around 8-10 m/s surrounding
and neighbourhood of the storm after assimilation of radiance along with GTS
observations as compared to the other two simulations. The simulated position
of the system from RAD experiment is well correlated with observed one.
The time series of the minimum MSLP and maximum sustainable wind
(m/s) at 10 m height from surface obtained from three experiments and along
with observation from IMD are represented in Fig. 4(a) and (b) respectively. It
Fig. 3:
Wind speed and magnitude (shaded m/s) at 850 hPa from (a) FNL; (b) GTS and
(c) RAD valid at 00 UTC 26 December 2011 (Int. time). Model simulated wind fields
(48 hrs) from (d) CNTL; (e) GTS and (f) RAD valid at 00 UTC 28 December 2011.


Search WWH ::

Custom Search