Geoscience Reference
In-Depth Information
Fig. 6:
Mean WS (KFFR).
Fig. 7:
Minimum WS (KFFR).
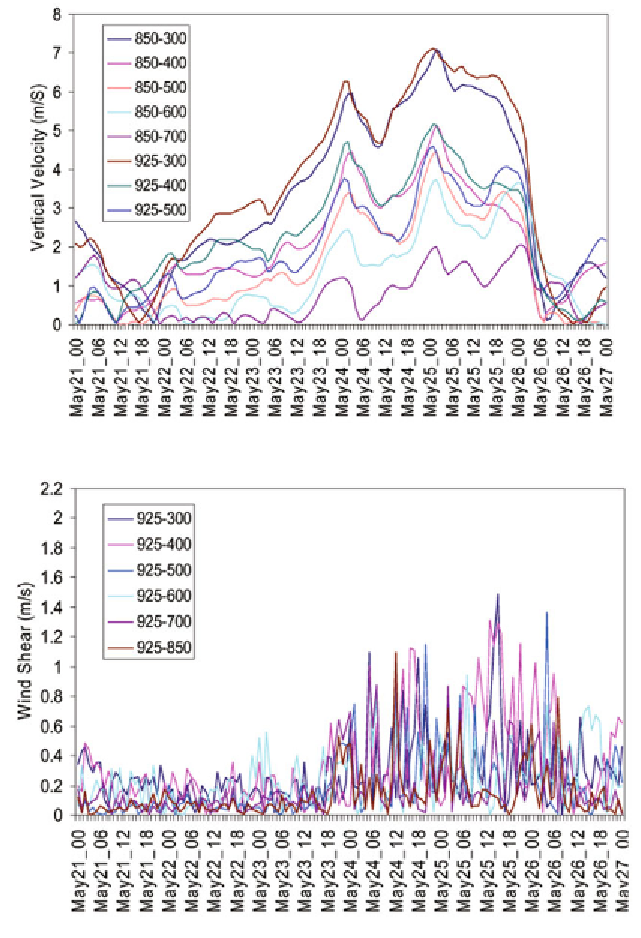
The vertical velocity (VV) in and around the system was very low in all
levels during 00 UTC of 21 May to 12 UTC of 22 May. After that it started to
increase first in the lower levels and then upward (Fig. 9). The average maximum
VV for KFFR, KFKS, KFLN, KFWSM3 and KFWSM5 of 3.97 ms
-1
, 2.45
ms
-1
, 4.70 ms
-1
, 6.84 ms
-1
and 5.62 ms
-1
were respectively at 350 hPa, 450

Search WWH ::

Custom Search