Geoscience Reference
In-Depth Information
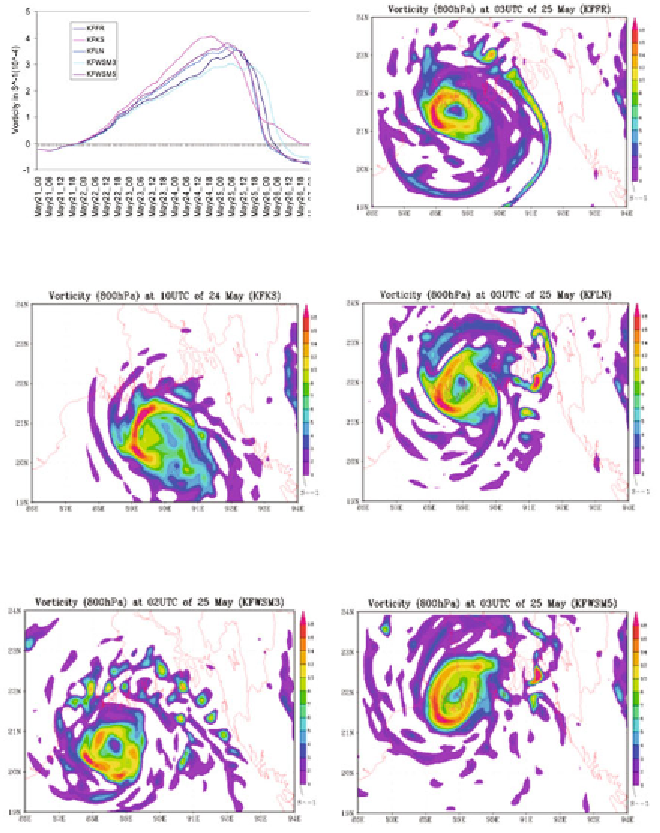
Fig. 5(a):
Vorticity variation.
Fig. 5(b):
Vorticity (KFFR).
Fig. 5(c):
Vorticity (KFKS).
Fig. 5(d):
Vorticity (KFLN).
Fig. 5(e):
Vorticity (KFWSM3).
Fig. 5(f):
Vorticity (KFWSM5).
Area average vertical wind shear (WS) and minimum WS was decreased
with the progress of time till 21 UTC of 21 May and then increased. It reached
the maximum value at about 03 UTC of 25 May and then decreased to a
minimum value at 06 UTC of 26 May (Figs 6 and 7). The WS between the
levels 850 hPa and 500 hPa level was low when the system was over Northwest
Bay and adjoining coastal area during its higher cyclonic state. This situation
helped to intensify the system just before landfall and kept the system energetic
with longer duration after making landfall (Fig. 8(a-e)).
Search WWH ::

Custom Search