Geoscience Reference
In-Depth Information
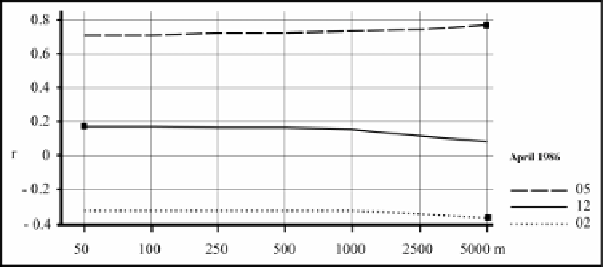
Figure 2.27.
Correlation coefficients for altitude/rainfall amount (measurements
taken on April 2, 5, and 12, 1986); the altitudes were generated by
seven DEMs, which had resolutions varying from 50 to 5,000 m
Figure 2.28.
Correlation coefficients for slope and topographic roughness/
rainfall amount (measurements taken on April 2, 5, and 12, 1986)
Topographic
variable
1971-2000 average
Monthly totals for 1986
Minimum
Maximum
Minimum
Maximum
Altitude
0.7
0.82
0.57
0.78
Slope
0.62
0.85
0.29
0.82
Roughness
0.35
0.55
0.08
0.57
Table 2.5.
Minimum and maximum r coefficients obtained for three different
topographic variables, which are correlated with total monthly rainfall
(average values and values for the year 1986)
Coefficients resulting from correlations that relate to monthly totals (expressed
over a 30 year average or throughout the year 1986) show that there is a strong
relationship between the coefficients and the resolutions of the DEMs: the
maximum values of the coefficients are always produced with the higher resolutions