Geoscience Reference
In-Depth Information
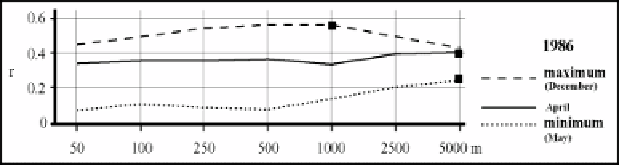
Figure 2.26.
Correlation coefficients for topographic roughness/rainfall
amount (April 1986)
2.4.4.4.
Estimating total rainfall recorded over the space of three days in April 1986
The results of the 3 days in April 1986 for which total rainfall was recorded are
shown in Figures 2.27 and 2.28. The 3 days in question were chosen in relation to
the contrasting coefficients that they had, and because of the heavy rainfall that
occurred on these days and which was recorded by the climatological stations
located in the area being studied.
Altitude
On April 5 and 12, 1986, the level of rainfall increased as the level of altitude
increased, however, the opposite was true for April 2, 1986. The negative value of r
which was recorded for April 2 can be explained by an unusual abundance of
rainfall in the Bourgogne region, and in particular, along the Saône plain, where
altitude levels are low. The relationship between rainfall and altitude was at its
strongest on April 5, 1986 (the value of r was approximately 0.75), and was lower
for the other two dates.
For each of the 3 days the resolution of the DEM did not affect the coefficients.
This was true for all resolutions up to 1,000 m. Resolutions above 1,000 m either
slightly improved (April 2 and 5) or slightly decreased the values of the coefficients
(as was the case on April 12).
Slope and topographic roughness
The values of the coefficients were positive for April 5 and 12, and negative for
April 2 (Figure 2.28). The maximum coefficient value obtained by the different
resolutions depended on the specific days in question:
- 5,000 m (for topographic roughness) or 500 m (for slopes) on April 5 (dashed
lines);
- 50 m on April 12 (dotted lines);
- 5,000 m (for topographic roughness) or 1,000 m (for slope) on April 2 (full
lines).
This was also true for the variable of altitude: in this case the coefficients also
varied greatly depending on the specific day in question.