Geoscience Reference
In-Depth Information
3.2.
Computational results
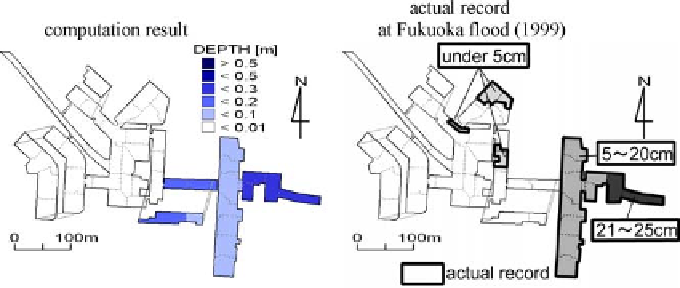
Figure 7 shows the comparison between the computed maximum water
depth distribution and the actual inundation record on the ground. The
computed inundated area shows good agreement with the actual inunda-
tion area. By this computation, the inflow water volume into the basements
of buildings and the water volume stored in the storage tank of the under-
ground mall amount to 6
.
0
10
4
m
3
, respectively.
Figure 8 shows the computed maximum water depth distribution and
the actual inundation record of the studied underground space. The com-
puted result is in almost good agreement with the actual record. The com-
puted water volume flowing into the subway track space is about 5,000 m
3
×
10
4
and 1
.
3
×
Fig. 7. Maximum inundation depth on the ground.
Fig. 8. Maximum inundation depth of the underground.