Geoscience Reference
In-Depth Information
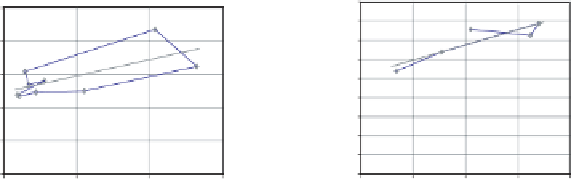
Graph of S' Vs. Storage ,S (x=0.25)
Graph of S' Vs. Storage ,S (x=0.4)
1800
2500
1600
y= 0.2474x + 1073.2
1400
2000
1200
y= 0.7862x +562.74
1500
1000
800
1000
600
400
500
200
0
0
600
1600
2600
3600
600
800
1000
1200
1400
Storage S, (cumec month)
Storage S, (cumec month)
Fig. 6.
Graphs of
S
against
S
for determination of
x
and
K
for the channel reach.
As demonstrated in Fig. 6, the plot having
x
= 0.4 gives the best straight
line.
K
was calculated as the inverse of the slope of the line of best fit. The
gradient of the line was obtained as
S
=0
.
7862 and the lag
K
is there-
fore taken as approximately 1.27 months, which is the time a flood wave
would take moving from the inlet to the outlet of the lake. Muskingham
coe
cients
C
0
,
C
1
,and
C
2
were estimated as
−
0
.
00695, 0.7986, and 0.2083,
respectively.
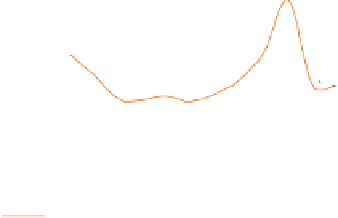
The routed flows were then compared with the actual flows. From the
channel routing graphs in Figs. 7-9, it is apparent that Lake Albert does
not really approximate to a channel its behavior in attenuating flood peaks.
In the case of Fig. 10, however, in the year of average inflow Lake Albert's
behavior has been approximately simulated. This is significant.
Flow Hydrographs for the Year of Maximum
Outflow,1964
10,000
8,000
6,000
4,000
2,000
0
Outflow
Routed Inflow
Actual Inflow
Months
Fig. 7.
Graph of flows for the year maximum outflow (1964).