Geoscience Reference
In-Depth Information
Year
08/28/76
05/25/79
02/18/82
11/14/84
08/11/87
05/07/90
01/31/93
10/28/95
07/24/98
04/19/01
01/14/04
0
10
20
30
40
Variable draft
Observed
Constant draft
Variabledraft and lateral flow
50
60
70
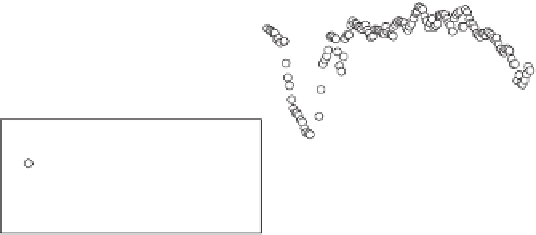
Fig. 4.
Groundwater level simulations obtained at OW7 for various cases.
be due to the impact of later inflows into zone 7, which are determined by
the upstream zones of 8 and 9. This analysis suggests the need for consid-
ering groundwater modeling of the entire subbasin connecting all the zones
rather than a lumped model for individual zones alone.
3.2.
Modeling the groundwater fluxes
The calibrated model is used to simulate the behavior of the groundwater
system from 1979 to 2000 using a variable draft pattern but with a no flux
boundary condition for the subbasin. Figure 5 shows that the simulated
responses for the water levels in OW8 and OW9 is in good agreement with
observed data up to 1984, but not in the later periods. More importantly,
the simulated water levels show an increasingly declining trend with years in
contrast to the observed responses. This might be attributed due to higher
drafts in zone 7 causing higher groundwater fluxes from zones 8 and 9 to
zone 7. In order to improve the performance of the model simulations, the
assumption of the no flux along the boundary forming zones 8 and 9 needs to
be relaxed.
7
Simulations are performed again for calibrating the boundary
fluxes in each year after 1984, in such a way that a good match is obtained
between the simulated and observed water levels in OW9 and OW8 (Fig. 5).
This approach gives good match with the observations in the wells in the
other zones 1-7. Figure 4 shows the fit obtained for OW7. The inflows into