Geoscience Reference
In-Depth Information
915
910
905
900
895
890
885
880
875
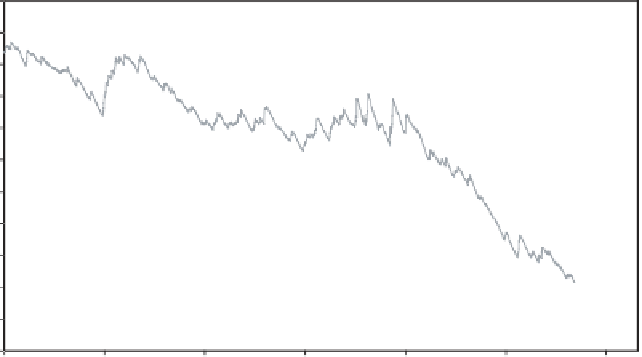
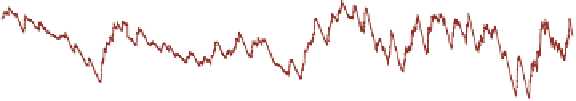
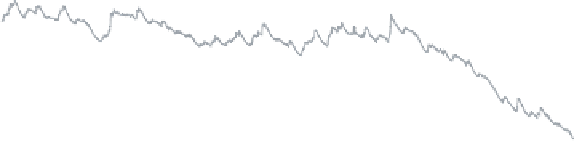
Observed ow8
Observed ow9
Simulations with no flow boundary
Simulations with flow boundary
870
865
860
05/25/79
05/24/83
05/23/87
05/22/91
05/21/95
05/20/99
05/19/03
Year
Fig. 5.
Groundwater levels simulations obtained at OW8 and OW9 for various cases.
all these zones show an increasing trend. The inflow is the highest for the
zone 7, which receives groundwater inflows from both zones 8 and 9. The
inflows into zones 9 and 8 might be due to the groundwater fluxes from
the neighboring Nugu subbasin adjoining the boundaries of zones 8 and 9
located in the Bandipur national park.
3.3.
Groundwater balance
The groundwater balance for the high pumping zone of 7 is shown in Table 1
for the period 1979-2000. The recharge factor is approximately 3.5% in
zone 7, which correlates with the different soil types found in this zone. The
net lateral flow into zone 7 is approximately 70% of the draft in this zone
for each of the periods. Thus, higher drafts over the years are sustained to
some extent from the increasing inflows into this zone from adjacent zones
of 8 and 9. The inflows into this zone have increased by 70% while draft
Table 1.
Average annual groundwater balance for zone 7 for a season.
Rainfall
Recharge
Inflow
Outflow
Draft
Storage change
Season
(mm)
(mm)
(mm)
(mm)
(mm)
(mm)
1979-1984
673.71
23.58
79.86
21.37
82.67
−
0
.
50
1984-1989
597.96
20.94
83.75
16.22
100.27
−
11
.
82
1989-1994
695.30
24.33
102.47
13.55
105.85
7.42
1994-1999
804.36
28.15
110.10
12.98
129.47
4
.
80
−