Geoscience Reference
In-Depth Information
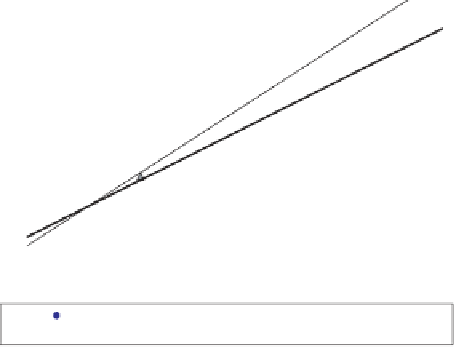
DROUGHT VOLUME VS SEVERITY
18
16
y = 0.0195x -0.7334
14
12
10
8
y = 0.0152x- 0.1273
6
4
2
0
0
200
400
600
800
1000
DROUGHT VOLUME (mm)
RAKAI
MASINDI
Linear (MASINDI)
Linear (RAKAI)
Fig. 6.
Severity against drought volumes.
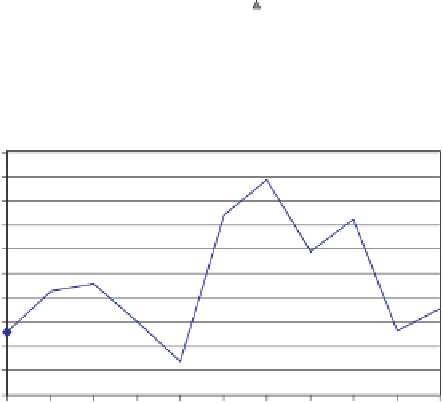
DROUGHT VOLUMES METHOD
1000
900
800
700
600
500
y = 17.892x - 34513
400
300
200
100
0
1950 1951 1952 1953 1954 1955 1956 1957 1958 1959 1960
YEARS
Fig. 7.
Drought volumes against time for Masindi (1950-1960).
a higher severity index than Rakai district for the same drought volume.
Furthermore, the droughts for Rakai district have a higher return period
than the droughts for Masindi district as shown in Fig. 5.
(2) The Lognormal distribution could be used to study drought in
both Masindi and Rakai districts. This distribution satisfied the two