Geoscience Reference
In-Depth Information
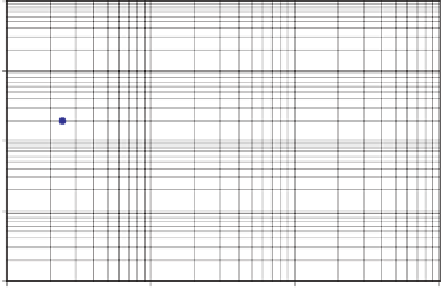
DROUGHT VOLUMES VS RETURN PERIODS
10000
y = 239Ln(x) - 17.819
1000
y = 199.21Ln(x) + 5.2083
100
10
1
1
10
100
1000
RETURN PERIOD (years)
RAKAI
MASINDI
Fig. 5.
Drought volumes against Return period.
Figure 6 shows a positive correlation between the severity index and
drought volume for both Masindi and Rakai.
4.3.
Comparison of SPI and drought volumes methods
Drought volumes and SPI values for various years were cumulated and
graphs were plotted to show their respective trends. Figures 7 and 8 clearly
show a similarity in the trends for Masindi, whereas Figs. 9 and 10 show
the similarity in trends for Rakai.
Figures 11 and 12 show a comparison between the values of SPI and
drought volumes in Masindi 1950-1960 and Rakai, respectively. The values
can be related using Eqs. (9) and (10).
SPI = 0
.
0044
V
+3
.
485
,
R
=0
.
86
,
(9)
SPI = 0
.
0058
V
+2
.
4531
,
R
=0
.
79
.
(10)
5. Conclusions
(1) The two regions have similar drought patterns. This is clearly shown
by the similarity of the plots for the two regions in Figs. 5 and 6.
However, Masindi district experiences relatively more severe droughts
than Rakai district. This is shown in Fig. 6, where Masindi district has