Geoscience Reference
In-Depth Information
(a)
(b)
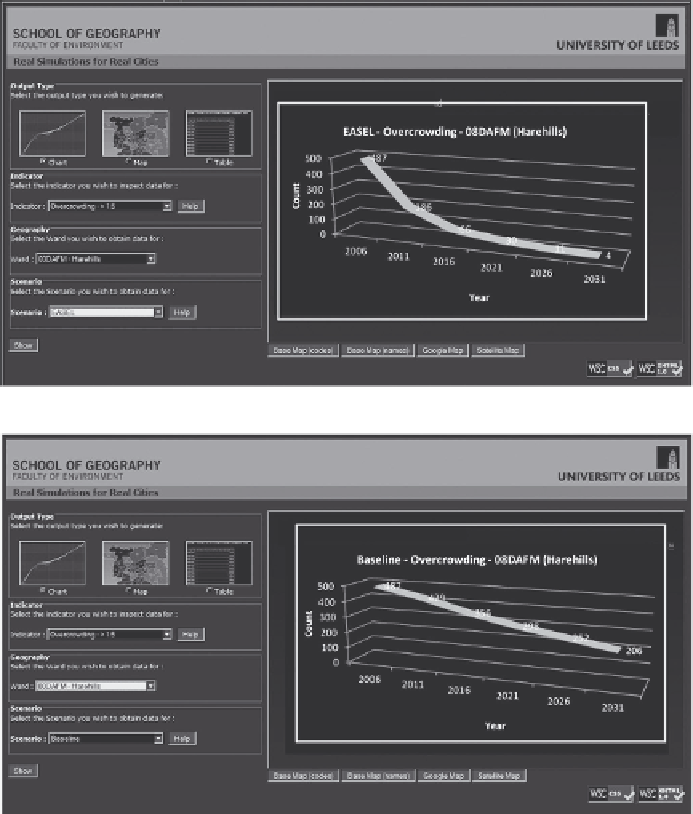
FIGURE 10.3
The teaching portal. (a) Future variations in a performance indicator (overcrowding) for a
new house building scenario. (b) Future variations in a performance indicator (overcrowding) for the baseline,
business-as-usual.
At
Step 3
, a SIM is executed to allocate traffic to the local road network, which balances traffic
demand with the distribution of employment destinations throughout the city. At this stage, a single
journey type from home to work is accommodated, and the transport mode is a simple trade-off
between private and public transport. A retail version of the SIM has also been implemented in
NeISS. This simulation model generates key outputs (
performance indicators
) at a neighbourhood
level and a city level. Major indicators include estimates of the number of road accidents, average
journey times and pollution levels. The workflow architecture now enables these outputs to be visu-
alised (
Step 4
) through an interface to the MapTube service (Batty et al., 2011). In essence, this com-
ponent simply accepts data about a series of neighbourhoods that it can recognise, displays these
data as a Google Map overlay and allows for certain fundamental mapping operations (definition of
legends and scales, pan, zoom and so on) before returning control to the main part of the simulation
at the request of the user.