Geoscience Reference
In-Depth Information
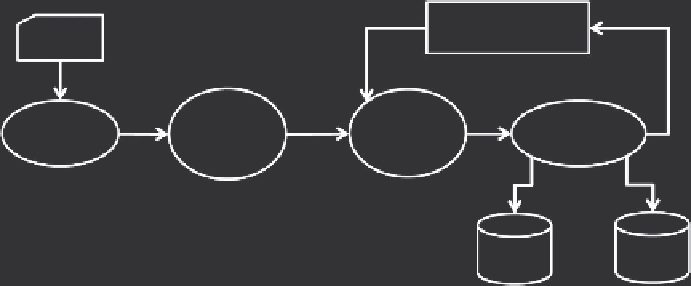
Scenario
Data
Dynamic
simulation
model
Spatial
interaction
model
Micro
simulation
Performance
indicators
Maps
Tables
FIGURE 10.2
An example NeISS workflow.
procedure is conceptually straightforward, the SIMs are reasonably complex. A fuller descrip-
tion is not relevant here, but we can make the general point that these workflows are themselves
typically hierarchical. For example, each of the SIMs is in itself a package of modelling services,
while the Dynamic Simulation Model (DSM) comprises a bundle of nine interlinked simulation
modules (see Birkin et al., 2009, for more discussion).
Illustrations of the teaching portal are shown in Figure 10.3. Here, we show how overcrowding
changes over the 30-year time frame of the simulation, with a detailed trend for one particular census
ward. Harehills is a low social status inner city area to the east of Leeds city centre. The introduc-
tion of a policy of a programme of housing investment in the East and South East Leeds (EASEL)
area allows much greater control to be exerted in relation to the overcrowding problem. Additional
investment in the EASEL region is one of eleven policy scenarios allowed in the simulator where
the policies are for health care, increased number of family doctors, hospital beds or social care for
the elderly; for housing, allowing greenbelt development, regeneration of urban (brownfield) sites,
balanced redevelopment or focused investment in the EASEL area; and for transport, introduction
of a supertram, congestion charge, road pricing or the combination of both a congestion charge and
a supertram. However, in principle, a much wider variety of options could quite easily be included.
10.5 TOWARDS A DECISION SUPPORT TOOL
It takes a relatively small leap of imagination to see how the teaching simulator could be extended as
a decision support tool for policy analysis in the real world. Suppose a planner in a British city wants
to see how much the transport network will deteriorate over the next 5/10/15 years if the population
continues to grow and nothing is done to control traffic problems.
At the beginning of the process (
Step 1
), baseline demographic data for the city are accessed.
This exploits the first modelling component of the architecture, a population reconstruction model
(PRM) which allows neighbourhood populations to be synthesised from a combination of individual
data and census small area statistics (Birkin et al., 2006). Next (
Step 2
), traffic demand is generated
by combining the PRM with transport activity data, which could be derived from a specialist source
like the National Travel Survey (Department for Transport, 2011). In the core application of NeISS,
the British Household Panel Survey (BHPS, now
Understanding Society
) is preferred in view of its
variety. Some relevant topics (amongst many) covered by the BHPS include main means of transport
to work, time spent travelling to work, children attending school outside the local catchment area
and how often respondents walk/swim/play sport or enjoy social and recreational activities such as
eating out and visiting the cinema. By implementing a single linkage mechanism between the PRM
and the BHPS, it is possible to mirror the whole variety of this panel survey at a small area level,
including financial and political attitudes, lifestyle data and social behaviour.