Geoscience Reference
In-Depth Information
sequences of waves which have just broken. This should lead us to a lower-bound estimate
of the dominant-breaking impact across the spectrum. Thus, there will be multiple seg-
ments of wave record used, from half-a-minute to a few-minutes long, to obtain spectra
based on these individual segments. The spectra obtained for the breaking segments and
those obtained for the non-breaking segments will then be averaged separately in order
to produce reliable estimates of the
incipient-breaking
spectrum and of the
post-breaking
spectrum.
As mentioned above, the spectrogram method developed by
Babanin
et al.
(
2001
) will
be used to segment the wave records. Spectrograms of the acoustic noise recorded by
hydrophone clearly demonstrate patches of enhanced and lowered noise level, which were
shown to be associated with the breaking activity of dominant waves at the wave-
measurement spot above the hydrophone (
Section 3.5
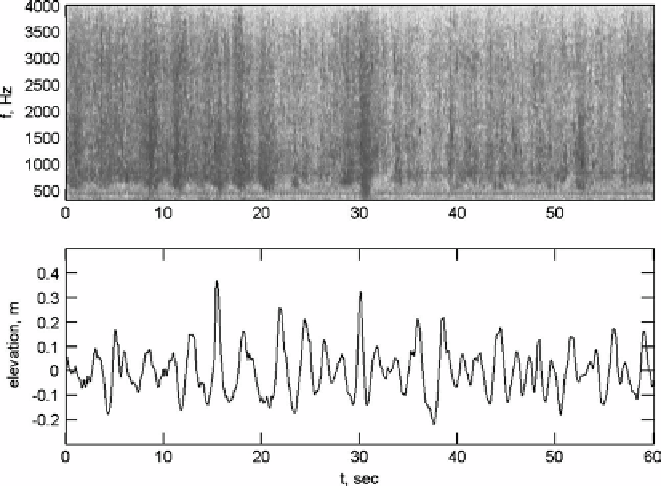
). For example, in
Figure 7.2
the
first 35 seconds would be an
incipient-breaking
segment and the last 25 seconds - a
post-breaking
segment.
Thus, a mean
incipient-breaking
spectrum
F
i
(
)
f
and a mean
post-breaking
spectrum
F
p
(
were obtained within the record with nearly 50% breaking rate. The two spectra are
shown in
Figure 7.3
. There is a clear difference between the spectra (note that the scale is
logarithmic), with
F
p
(
f
)
f
)
having consistently lower spectral density as one would expect.
Figure 7.2 (Top panel) Spectrogram of acoustic noise of one minute of the record. Dark crests are
associated with breaking waves. (Bottom panel) Synchronous surface elevation record. Figure is
reproduced from
Young & Babanin
(
2006a
) © American Meteorological Society. Reprinted with
permission
Search WWH ::

Custom Search