Geoscience Reference
In-Depth Information
6.1 Introduction
Maps show locations; in addition, they often show themes. Themes can be
ways to conceptualize the Earth, composed of biomes or watersheds, for
example, or a series of events, such as a theme of the Napoleonic wars, or
a specific variable, such as median age by country or by census tract, or in
myriad other ways (Tufte, 1990).
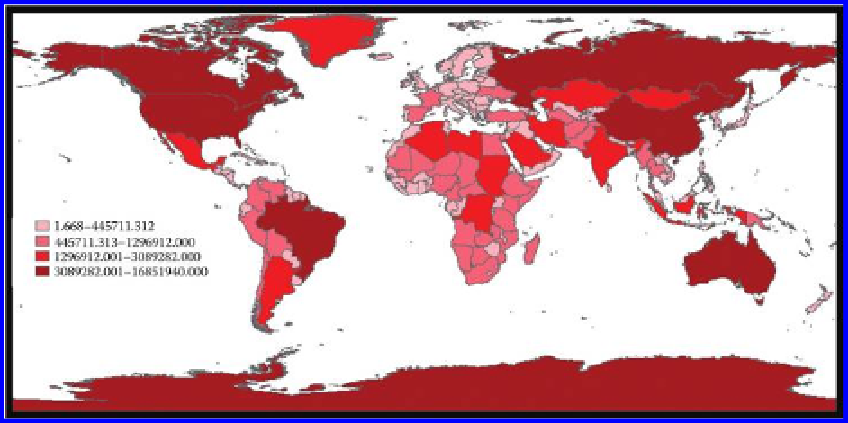
Figure 6.1
shows a “thematic” map. In it, a
set of data, or theme, has been partitioned into intervals. In theory, there are
an infinite number of ways available to partition each theme. In practice, a
finite set is typically employed. The method one chooses to partition the data,
into mutually exclusive ranges, has a profound impact on how the resulting
map appears and how it is interpreted (Monmonier, 1993, 1996).
6.2 The choice of data ranges
Different schemes of partitioning data can lead to vastly different maps. The
classes, or data ranges, in each map. The variable (attribute) being mapped is
“area”—that is, land area. The purpose of taking care in selecting a ranging
method is twofold:
• To facilitate the reading and understanding of the map.
• To reveal information that is not otherwise self-evident.
area by nation partitioned into four classes (ranges), which are then mapped
using a scale of reds. In this sequence, notice the differences in the appearance
Figure 6.1 Land Area (square kilometers) partitioned by Natural Breaks. Source of
base map: Esri software.
Search WWH ::

Custom Search