Geoscience Reference
In-Depth Information
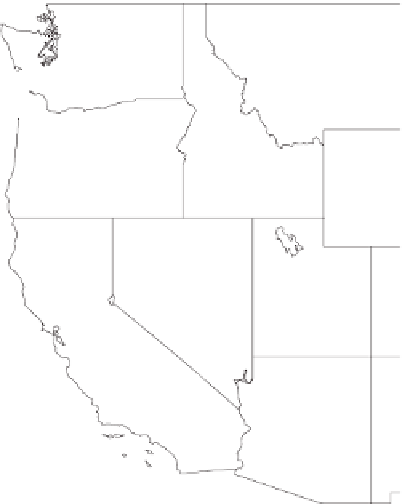
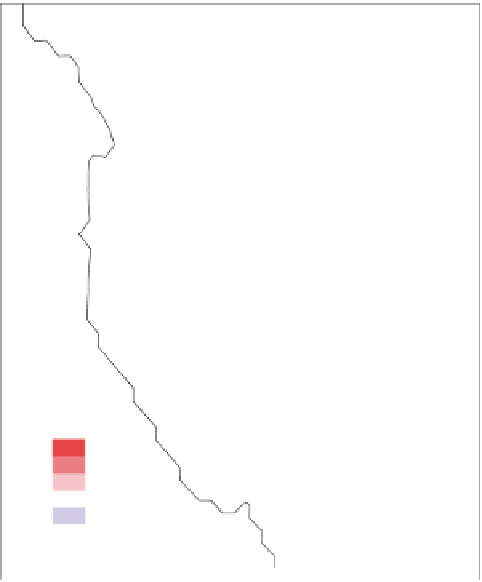
Mean Annual Precipitation (1971-2000)
Precipitation (in)
<
4
4-8
8-12
12-16
16-20
20-24
24-28
28-32
32-36
36-40
40-50
50-60
60-70
70-80
80-100
100-120
120-140
140-160
160
+
e PRISM Group, Oregon State University
http://prism.oregonstate.edu
FIGURE 1.1
Mean.annual.precipitation.from.PRISM.(Daly.et.al..2002,.2004,.2008).for.the.1971-2000.
period.of.record..Note.the.sharp.gradients.in.much.of.the.West.
2.0
1.5
1.0
0.5
0.0
-0.5
FIGURE 1.2
Linear.trends.in.temperature.(°C/century).from.the.HadCRU.0.5°.×.0.5°.dataset,.evalu-
ated.over.the.1901-2000.period..The.contour.interval.is.0.5°C.per.century.