Geoscience Reference
In-Depth Information
Annual
DJF
JJA
10°C
7
5
3.5
3
2.5
2
1.5
1
0.5
0
−0.5
−1
70°N
70°N
70°N
50°N
50°N
50°N
30°N
30°N
30°N
10°N
10°N
10°N
180°
140°W
100°W
60°W
20°W
180°
140°W
100°W
60°W
20°W
180°
140°W
100°W
60°W
20°W
50%
30
20
15
10
5
0
−5
−10
−15
−20
−30
−50
70°N
70°N
70°N
50°N
50°N
50°N
30°N
30°N
30°N
10°N
10°N
10°N
180°
140°W
100°W
60°W
20°W
180°
140°W
100°W
60°W
20°W
180°
140°W
100°W
60°W
20°W
21 Models
19−20
17−18
14−16
8−13
5−7
3−4
1−2
0
70°N
70°N
70°N
50°N
50°N
50°N
30°N
30°N
30°N
10°N
10°N
10°N
180°
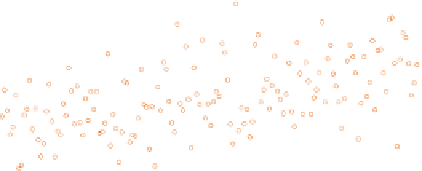
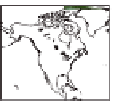
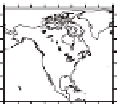
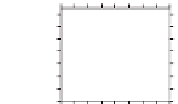
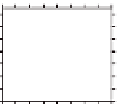
FIGURE 1.5
Maps. of. changes. (departures. from. 1971-2000. mean). in. climate. elements. for. the. late-
twenty-irst. century. (2080-2099). derived. from. an. ensemble. summary. of. 21. global. climate. models.
(Christensen.et.al..2007,.their.Figure.11.12).for.emissions.scenario.A1B..Top.row:.Temperature.depar-
ture. in. °C.. Middle. row:. Precipitation. departure. in. percent,. with. green. indicating. wetter. and. brown.
indicating.drier..Bottom:.Number.of.models.agreeing.on.wetter.than.average.out.of.21.models;.green.
indicates. agreement. on. wetter. and. brown. is. agreement. on. drier.. Columns—Left:. Annual.. Middle:.
Winter.(December-February)..Right:.Summer.(June-August).
180°
140°W
100°W
60°W
20°W
180°
140°W
100°W
60°W
20°W
140°W
100°W
60°W
20°W
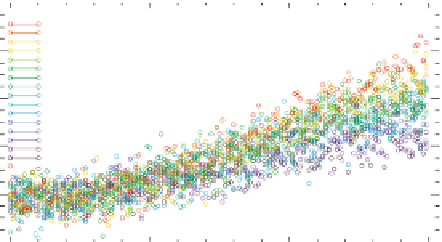
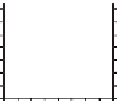
Western US mean temperature
8
miroc3_2_medres.1
ipsl_cm4.1
ukmo_hadcm3.1
miub_echo_g.1
gfdl_cm2_0.1
mpi_echam5.1
gfdl_cm2_1.1
ncar_ccsm3_0.1
cnrm_cm3.1
inmcm3_0.1
bccr_bcm2_0.1
cccma_cgcm3_1.1
ncar_pcm1.1
mri_cgcm2_3_2a.1
giss_model_e_r.2
csiro_mk3_0.1
6
4
2
0
−2
1950
2000
2050
2100
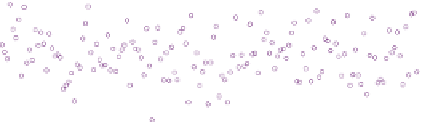
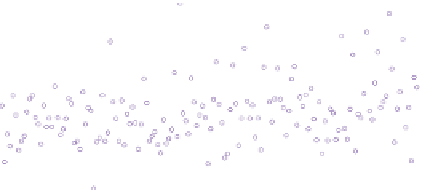
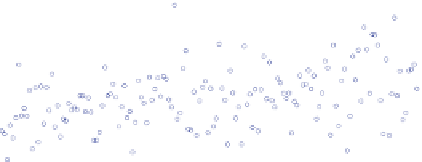
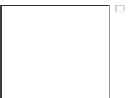
Western US mean precipitation
60
30
0
−30
−60
1950
2000
2050
2100
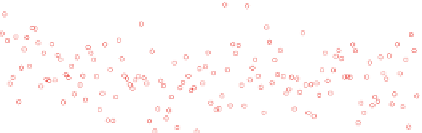
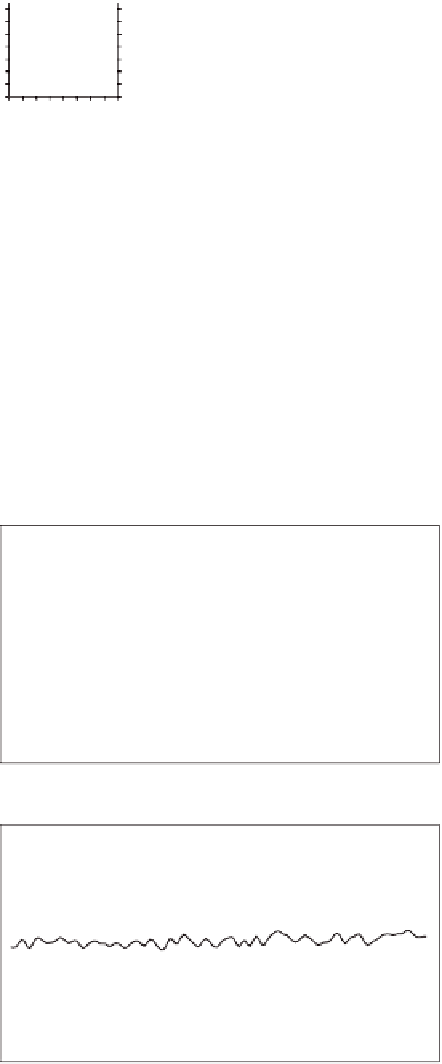
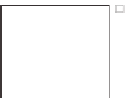
FIGURE 1.6
Western-US.annual.mean.temperature.and.precipitation.for.16.climate.models.(colored.
circles,.names.and.runs.shown).along.with.the.all-model.mean.(heavy.black.curve)..Greenhouse.gas.and.
aerosol.forcing.follows.the.observed.for.1950-2000.and.then.the.A1B.scenario.for.2000-2100..