Geoscience Reference
In-Depth Information
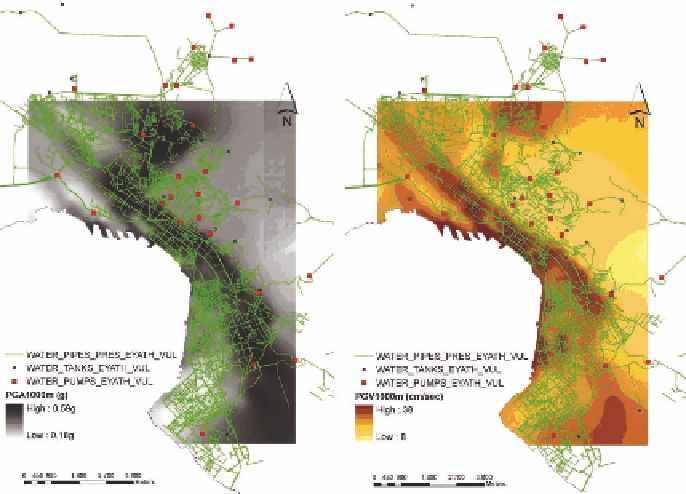
Fig. 18.19. Spatial distribution of
PGA
(left)and
PGV
(right)values inThessaloniki for
the seismicscenario of 1000 years
andDeyoevulnerabilitycurve(eq.18.7)andtheestimated
PGS
reportedinFigure18.16.
The number of failures for the total length of the pipes in each district define the dam-
age state as follows: low: 10
50 estimated damages per
district. The agreement among the approaches is good in certain districts but not for the
entire system. Based on the case of Duzce we may conclude that while the methods for
specifying and calculating
PGS
are improving, vulnerability curves in terms of
RR
/km-
PGS
deserve furtherstudies.Ingeneral thespatialdistributionofdamages ofthe potable
water system is reasonably well correlated to the actual observed damages illustrated in
Figures 18.11 and 18.12, with the exception of certain districts having limited length of
pipes and hence lower probability of having many failures.
<
, moderate: 10-50, and high
>
The second example of risk assessment of a complex water system comes from
Thessaloniki. For the 1000 years scenario (SRMLIFE research project, 2003-2007),
Figure 18.19 present the estimated hazard parameters in terms of
PGA
and
PGV
values.
Toassessthevulnerabilityanddamageratesweappliedagaintheempiricalvulnerability
relationship of eq. (18.6) for the pipes and appropriate fragility curves for reservoirs and
pumping stations (NIBS, 2004). In Figure 18.20 we illustrate the expected damages in
the potable water system, consisting of reservoirs, pumping stations, and few hundred of
kilometers of pipes.