Geoscience Reference
In-Depth Information
3.5
2.0
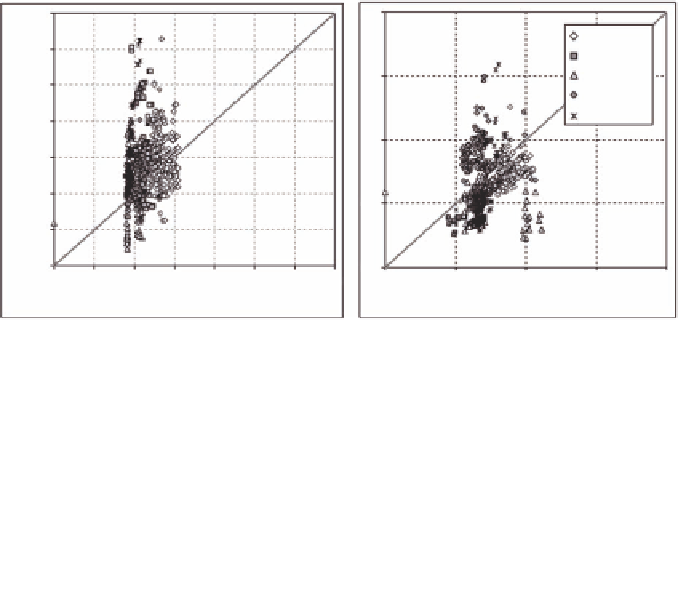
Ss
S1
BAKIRKOY
BANDIRMA
GEMLIK
KORFEZ
TEKIRDAG
3.0
1.5
2.5
2.0
1.0
1.5
1.0
0.5
0.5
0.0
0.0
0.0
0.0
0.5
1.0
1.5
2.0
2.5
3.0
3.5
0.5
1.0
1.5
2.0
Spectral Acc. for T = 0.2 s by NEHRP
Spectral Acc. for T = 1s by NEHRP
Fig. 4.13. Correlation between spectral accelerations at 0.2 and 1scalculated bysite
response analyses and based on NEHRP formulation for all five cities
Table 4.1. N
EHRPSite classification with respectto equivalent shear w
ave velocities
Siteclassification Average shear wave velocity range
A
Veq
>
1500m
/
s
B
1500m
/
s
>
Veq
>
760m
/
s
C
760m
/
s
>
Veq
>
360m
/
s
D
360m
/
s
>
Veq
>
180m
/
s
E
Veq
<
180m
/
s
assigning different earthquake characteristics leading to different time history inputs for
eachcellandduetothedifferencesinthesoilprofile,itappearslogicaltousethespectral
accelerationvaluesobtainedfromsiteresponseanalysisforthevulnerabilityassessment.
However,itisalsopossibletoarguethatthesophisticationintroducedduringthisprocess
may not always give more correct or accurate results. In addition, the decision of using
one of the spectral accelerations determined by best envelope approaches would play
a very important role on the amplitude of the estimated vulnerability of the building
stock.
At the present, one way to resolve these ambiguities is to rely on expert judgement and
previously obtained damage data in similar earthquakes. However, the statistical eval-
uation of all the spectral accelerations obtained by both procedures may be useful in
the decision process. One possible and positive interpretation of these results could be
towardssupportingthereliabilityofthesiteresponseanalysesandthusonemayconclude
that it may be recommendable to conduct site response analyses to determine spectral
accelerations and PGA on the ground surface to be utilised in assessing the vulnerability
of the building stock rather than using the NEHRP procedure which appears to be rather
limited.