Geoscience Reference
In-Depth Information
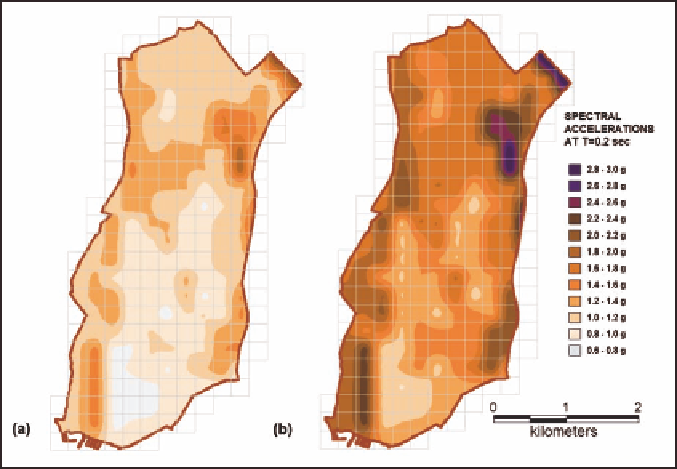
Fig. 4.12. Comparison of zonation withrespect tospectral acceleration at T
2s
calculated as (a) theaverage of all siteresponse analyses and (b) corresponding
to 10% exceedance probability
=
0
.
In order to determine the vulnerability of the building stock, the earthquake ground
motion characteristics used in the assessment of the structural vulnerability may be cal-
culatedbasedontheconventionalNEHRPprocedureconsideringthemicrozonationmap
obtained in terms of NEHRP siteclassification aswell as by siteresponse analyses.
The comparison between the spectral accelerations obtained from site response analy-
ses using the best envelope fitting procedure with the values obtained by the NEHRP
formulation indicates as shown in Figure 4.13 that the values obtained by site response
analyses shows much larger scatter. The difference in the data range is much more sig-
nificant in the case of short period spectral accelerations. This may be the indication of
more accurate determination of site effects. This is partly due to the fact that shear wave
velocity ranges used inthe NEHRP siteclasses are defined withinrelatively large ranges
as shown in Table 4.1.
Most of the cells in the study areas were classified as NEHRP class C or D, as a result
the spectral accelerations calculated on the ground surface based on the conventional
formulation using NEHRP site related parameters F
a
and F
v
were same and the minor
differences were due to the differences in the outcrop motion characteristics determined
from theearthquake hazard study.
Thevariabilityofthecalculatedparameterstobeusedforthevulnerabilityassessmentof
thebuildingstockisanimportantfactor.Consideringthevariabilitytakenintoaccountby