Geoscience Reference
In-Depth Information
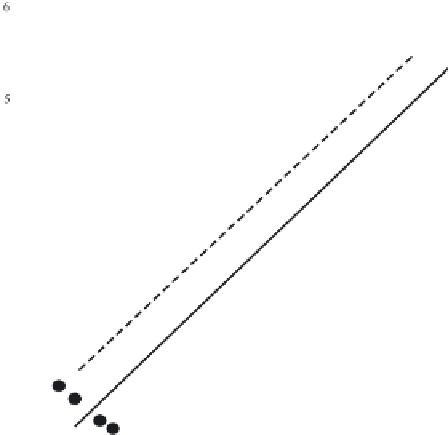
Fig. 2.3 The area of the fault at the source of the earthquake (solid line) versus the seismic moment
(magnitude). Adapted from [Kanamori, Brodsky (2004)]. The dotted line represents an estimation
of the area of the tsunami source in accordance with formula (2.3)
at an earthquake source,
T
EQ
. Note that deformation of the sea-floor (especially in
the case of strong earthquakes) does not proceed simultaneously over the entire area
of the tsunami source, but propagates horizontally following the fault that forms
at the earthquake source. Therefore, the duration of the sea-floor deformation at
a certain point may turn out to be significantly shorter than the quantity
T
EQ
.Inthe
Harward seismic catalogue (http://www.seismology.harvard.edu/) a temporal char-
acteristic termed 'half duration' is presented, which corresponds to half the duration
of the process at an earthquake source. We shall denote this quantity by
T
hd
[s].
Analysis of all the earthquakes of magnitude
M
w
>
7, presented in the Harward cat-
alogue for the period between January 1976 and March 2005 (370 events) permitted
us to obtain the following regression relationship:
lg
T
hd
=(0
.
42
±
0
.
02)
M
w
−
(1
.
99
±
0
.
14)
.
(2.5)
Such a range of amplitudes was chosen, because significant tsunamis are excited
by earthquakes with M
w
>
7.
Figure 2.4 demonstrates the relation between the above temporal scales and the
earthquake magnitude. In constructing the dependences we have applied formulae
(2.3) and (2.5) and, besides, for definiteness, we have assumed the ocean depth to
vary between 10
2
and 10
4
m.