Geoscience Reference
In-Depth Information
(a)
(b)
(c)
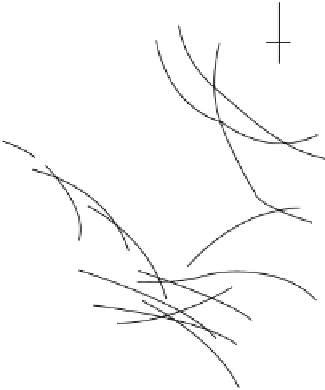
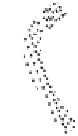
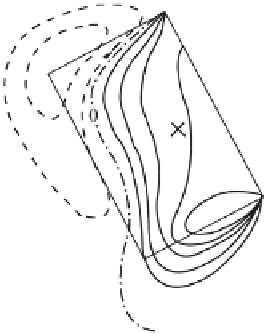
Fig. 2.2 Tsunami source restored applying the method of inverse isochrones (b), and residual de-
formations of the sea-floor (c) for the Tokachi-Oki 1968 earthquake. The figures are the num-
bers of mareographs, the locations of which are shown in the map (a). The solid and dot-
ted curves correspond to the positive and negative leading wave, respectively. Adapted from
[Satake, Imamura (1995)]
extension of the source,
T
TS
=
R
TS
(g
H
)
−
1
/
2
. Note that the order of the tsunami wave
period depends precisely on the quantity
T
TS
. In a similar manner one can also in-
troduce the propagation time of a hydroacoustic wave along the source,
T
S
=
R
TS
/
c
,
where
c
is the speed of sound in water. The maximum period of normal elastic os-
cillations of a water layer,
T
0
= 4
H
/
c
, is also related to hydroacoustic waves. And,
ultimately, there exists a time that characterizes the duration of a process occurring