Geoscience Reference
In-Depth Information
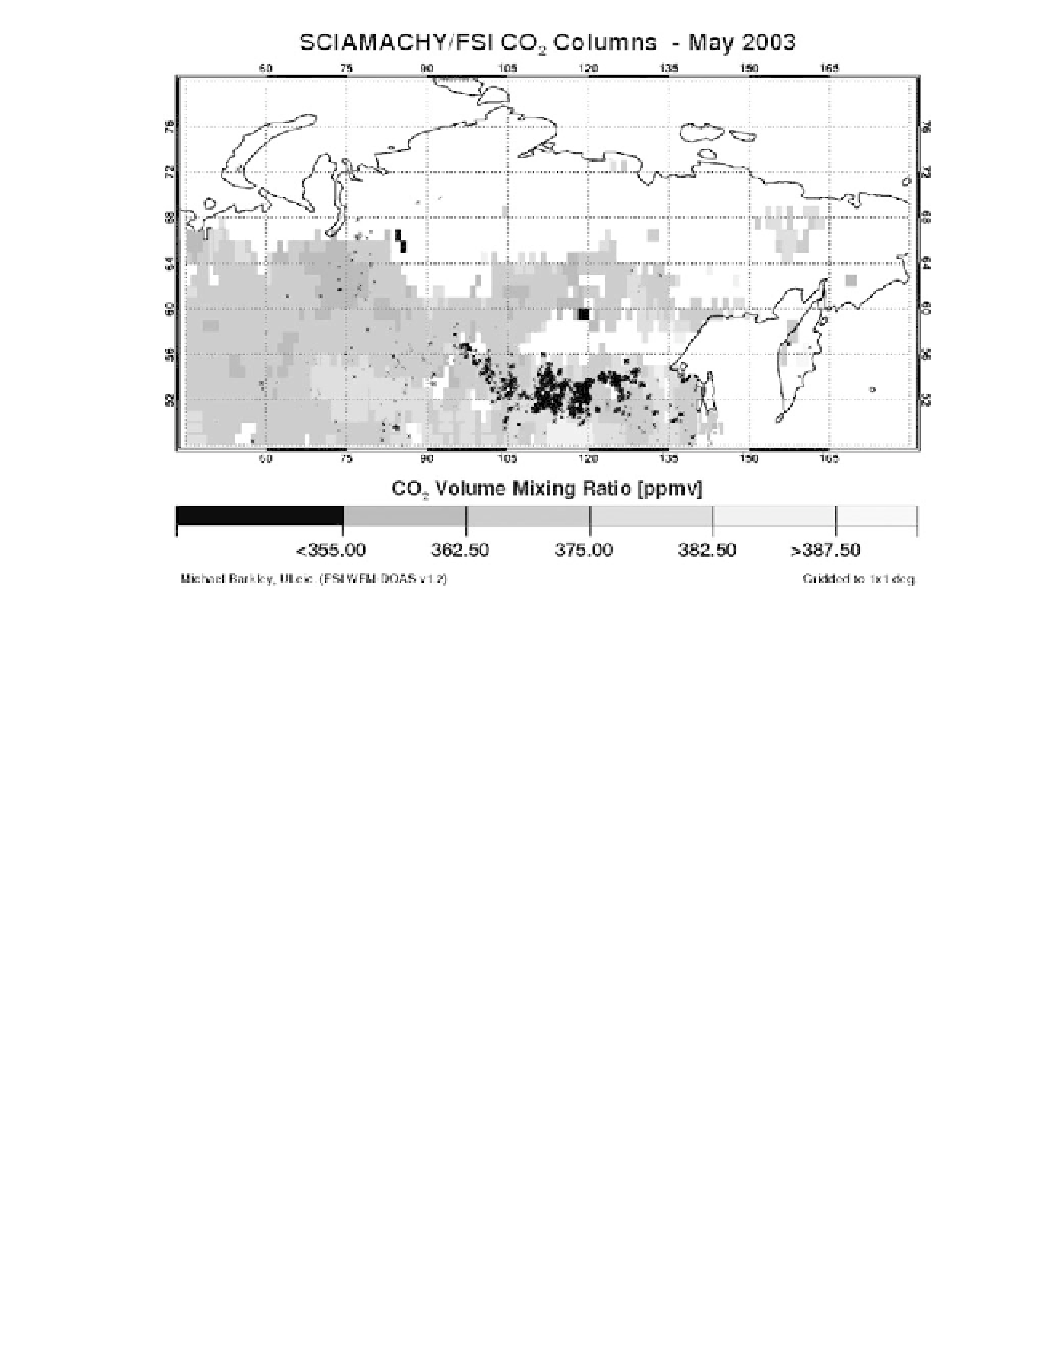
Figure 19.7
CO
2
volume mixing ratio retrievals over Siberia in May 2003. The black
dots represent fi re counts from MODIS thermal anomaly data, which are clearly con-
centrated to the north of the elevated CO
2
region. Figure provided by M. Barkley and
P. Monks, University of Leicester.
carrying a whole range of instruments, including SCIAMACHY (SCanning Imaging
Absorption spectroMeter for Atmospheric CartograpHY). SCIAMACHY is a passive
ultraviolet, visible/near-infrared (240-2380 nm wavelengths) hyper-spectral spec-
trometer. To retrieve concentrations of the most important greenhouse gas - CO
2
- from space observations, Barkley et al. (2006a) developed the Full Spectral Initia-
tion (FSI) WFM-DOAS retrieval algorithm. It extends previous work on the WFM-
DOAS algorithm by Buchwitz et al. (2006), and is aimed at SCIAMACHY
measurements in the near-infrared (NIR) domain. Different spectral wavelength
intervals can be used to retrieve concentrations of a range of atmospheric gases,
including carbon dioxide, methane and carbon monoxide from the NIR (Buchwitz
et al., 2004; Buchwitz et al., 2005), water vapour from the near-visible (Noel et al.,
2004), and ozone from the UV (Coldewey-Egbers et al., 2005). These gases show
specifi c absorption features in the electromagnetic spectrum as the radiation from
the sun passes through the atmosphere before reaching the sensor. The algorithm
by Barkley et al. (2006b) generates absorption spectra using the radiative transfer
model SCIATRAN (Rozanov et al., 2002). It accounts for the expected climatologi-
cal conditions at the time of the satellite observation, the latitude of the ground
pixel, the solar zenith angle and aerosols (Barkley et al., 2006b). A monthly com-
posite of the atmospheric CO
2
volume mixing ratio for May 2003 over Russia
retrieved by this method is shown in fi gure 19.7. Also shown in fi gure 19.7 are the