Geoscience Reference
In-Depth Information
x-Direction (cm)
200
0
100
0
10
20
30
A
B
40
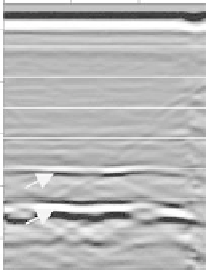
fIGURe 25.3
Nonmigrated radargram as recorded prior infiltration. Arrows indicate reflectors (A = elec-
trode grid; B = concrete bottom). The radargram revealed the layered structure of the sand body.
directly subtracting the corresponding amplitudes of all radar traces (250 per time step) from the
two treated time steps (∆t = 15 min). The result of such a computation must be read from top to the
lower limit. Regions that appear rather uniform are unchanged from time step to time step. In con-
trast, certain reflection patterns (A in Figure 25.2) have changed with time, indicating the moving
water front. Most of the visible reflections are artefacts or altered characteristics of very dominant
reflections (e.g., concrete base of lysimeter). The nonmigrated radargram showed the construction
basis of the lysimeter (concrete) at 2.50 m (Figure 25.3). Furthermore, a layered structure of the sand
became visible which was possible due to the filling procedure of the lysimeter (layer-wise filling
and compaction).
25.3.2 s
e a s o n a l
s
of i l
w
a t e R
c
o n t e n t
c
h a n g e s
The weighed lysimeters exhibited a change of soil water content over the entire 2 m profile of
140 mm over the investigation period (1 year; Figure 25.4a). It has to be noted that no depth-resolved
water content distributions were registered. The greatest water content changes occurred during the
vegetation period from March to September due to enhanced evaporation. Correspondingly, the
reflection times of the electromagnetic waves reduced from 25 to 15 ns (Figure 25.4b).
The relation between the soil water storage change and the change in travel times is depicted in
Figure 25.5. The scattering is higher in the dry range and lower in the wet range. This is mainly due
to the lower signal-to-noise ratio under the drier condition, when it was uncertain to determine the
reflection time. The permittivity was calculated from the reflection time, and the soil water content
was estimated using the lysimeter data. The results of the measured relation between the relative
dielectric constant and the water content are shown in Figure 25.6. The following calibration curve
was fitted to the data:
θ = 0.0245 ε - 0.0304
(25.1)
The standard deviation between the fitted curve and data is 15 mm (= 0.01 m
3
/m
3
). Using only data
of the wetter range, where the scattering of the GPR measurements was less pronounced, the stan-
dard deviation reduces to 4 mm (= 0.00026 m
3
/m
3
).
The results were compared to three calibration curves developed for TDR (Figure 25.6):
Topp et al. (1980):
θ = -0.053 + 0.0293ε - 0.00055ε² + 0.0000043ε³
(25.2)