Geoscience Reference
In-Depth Information
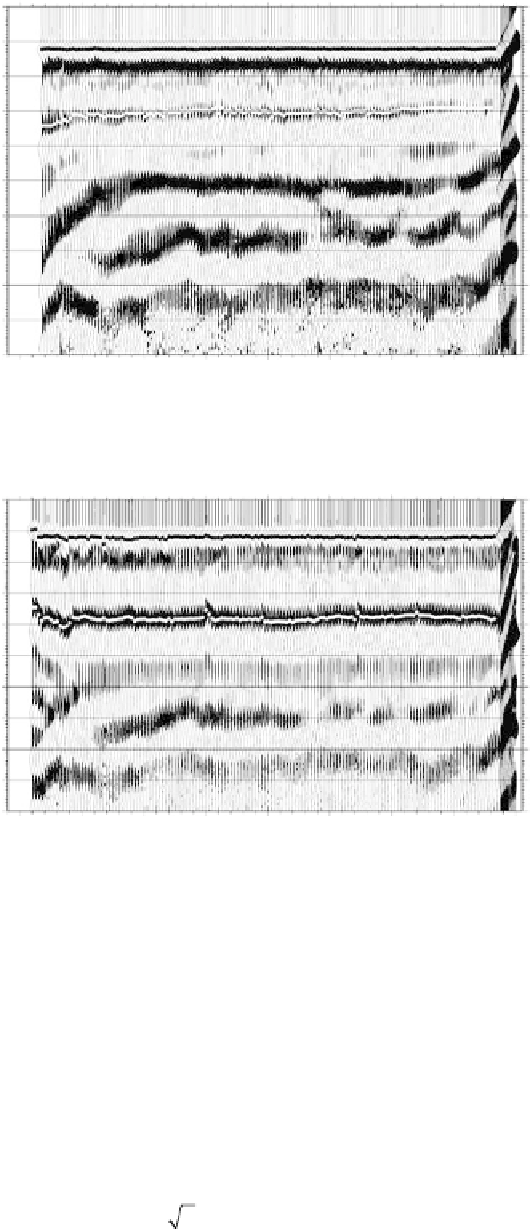
EW Sept Line at 16 m
We st
East
0
0
10
10
20
20
30
30
40
40
50
50
60
60
70
70
80
80
90
90
100
100
0
5
10
15
20
Distance (m)
(a)
25
30
35
40
EW January Line at 16 m
We st
East
0
0
10
20
30
40
50
60
70
80
90
100
10
20
30
40
50
60
70
80
90
100
0
5
10
15
20
Distance (m)
25
30
35
40
(b)
fIGURe 23.6
Similar plots to Figure 23.5, showing data from (a) September and (b) January. Note the
weaker ground wave energy and the earlier arrival time of the September profile. The September data are
more similar to the data from May. The January data have similar arrival times and amplitudes compared to
the March data. Annotations are the same as Figure 23.5.
converted to the dielectric constant by Equation (23.3). A more direct way to determine the dielec-
tric constant is to use the arrival times of the air and ground arrivals without first converting to
velocity. The square root of the dielectric constant can be computed from the air and ground wave
travel time picks (Huisman et al., 2001):
(
)
+
ct
−
t
x
ground
air
κ=
(23.3)
x