Geoscience Reference
In-Depth Information
EW March Line at 16 m
We st
East
0
0
10
10
20
20
30
30
40
40
50
50
60
60
70
70
80
80
90
90
100
100
0
5
10
15
20
Distance (m)
(a)
25
30
35
40
EW May Line at 16 m
We st
East
0
0
10
10
20
20
30
30
40
40
50
50
60
60
70
70
80
80
90
90
100
100
0
5
10
15
20
Distance (m)
(b)
25
30
35
40
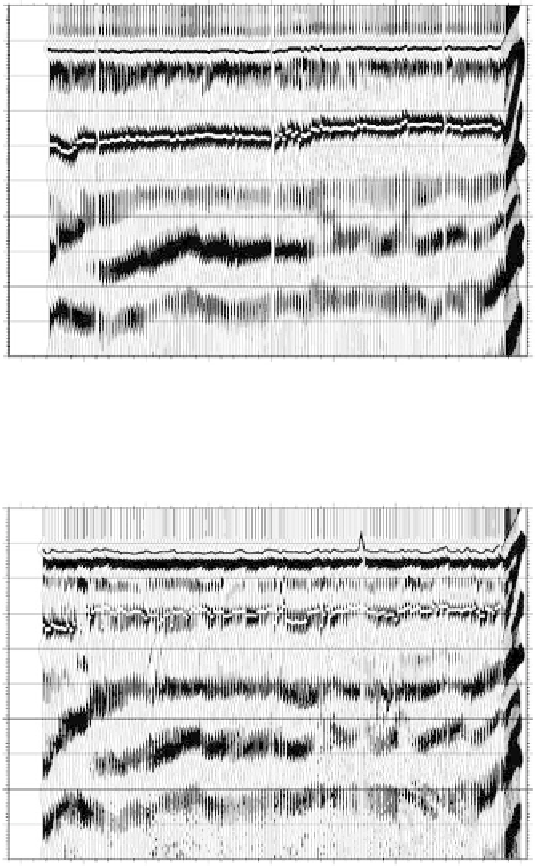
fIGURe 23.5
The wide-offset reflection (WOR) data from (a) March and (b) May. Note the weaker ground
wave amplitudes and the earlier arrival times in the May profile compared to the March profile. The air wave picks
are marked by the black line; the ground wave picks are marked by the light gray line. Bad picks on the right side
(walkaway stage) of the sections are due to a poorly defined picking window and are ignored in the interpretation.
rates of evapotranspiration in the summer months. During the winter months, higher precipitation
and reduced evapotranspiration cause an increase in soil moisture.
The WOR GPR data analysis consists of picking the arrival times of the air and ground waves.
To quantify changes in soil moisture content, we first determine the dielectric constant of the mate-
rial sampled by the radar energy. The EM velocity of the air and ground waves is simply the dis-
tance between the antennas divided by the travel time between antennas. The EM velocity is then

