Geoscience Reference
In-Depth Information
Montana
Idaho
Iowa
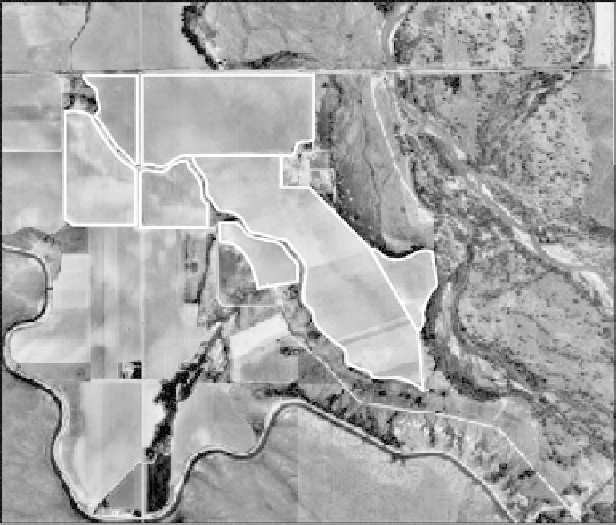
fIGURe 20.1
Aerial image of the irrigated farmland at SAREC.
variability. Spatial data will help future management and design of research projects. Existing EC
a
and yield data will be analyzed to identify possible problem areas. The integration of this baseline
information means that much more will be known about the soils at SAREC before research begins
than during the establishment of any previous Wyoming research and extension center. In this case
study, we present a summary of the baseline data and briefly discuss their uses.
20.2 MethodS
Baseline data were collected as follows. In late summer 2003 and spring 2004, measurements of
soil EC
a
were taken using the Veris 3100 Soil Mapping System (Veris Technologies, Salina, KS).
The Veris unit has six coulter electrodes mounted on an implement that is pulled by a pickup truck.
The unit simultaneously measured EC
a
at two soil depths, referred to as “shallow” (0 to 0.3 m) and
“deep” (0 to 0.9 m) EC
a
readings, and recorded their spatial coordinates using a Global Positioning
System (GPS) unit (Lund et al., 1999). Maneuvering speeds through the field averaged 11 km/hr
with measurements taken every second on 12 m swath widths, corresponding to an average 3 m
spacing between measurements in the direction of travel. Figure 20.2a shows the raw EC
a
data for
the entire irrigated area at SAREC. The irrigated fields were named after states whose shape they
most resembled. A total of 47,500 EC
a
readings were collected in the irrigated fields, represent-
ing approximately 330 data points per ha (or one point every 30 m
2
). This level of detail is helpful
because many research studies occupy much less than 1 ha, but published soil surveys typically do
not map areas smaller than 0.5 ha.
Soils were sampled on a 1 ha grid the same day EC
a
measurements were taken to characterize
soil variability. Sample depths were 0 to 0.3, 0.3 to 0.6, and 0.6 to 0.9 m. Soil water content, paste
pH, saturated paste electrical conductivity (EC), particle size distribution, and organic matter were
determined using standard procedures.