Geoscience Reference
In-Depth Information
a
EC
a
(mS/m)
0.4-22.0
22.1-39.0
39.1-58.2
58.3-144.7
144.8-299.6
Saline seep
b
Yield (kg/ha)
178-1639
1640-2504
2505-3348
3349-4297
4298-6871
Saline seep
0 41
330 m
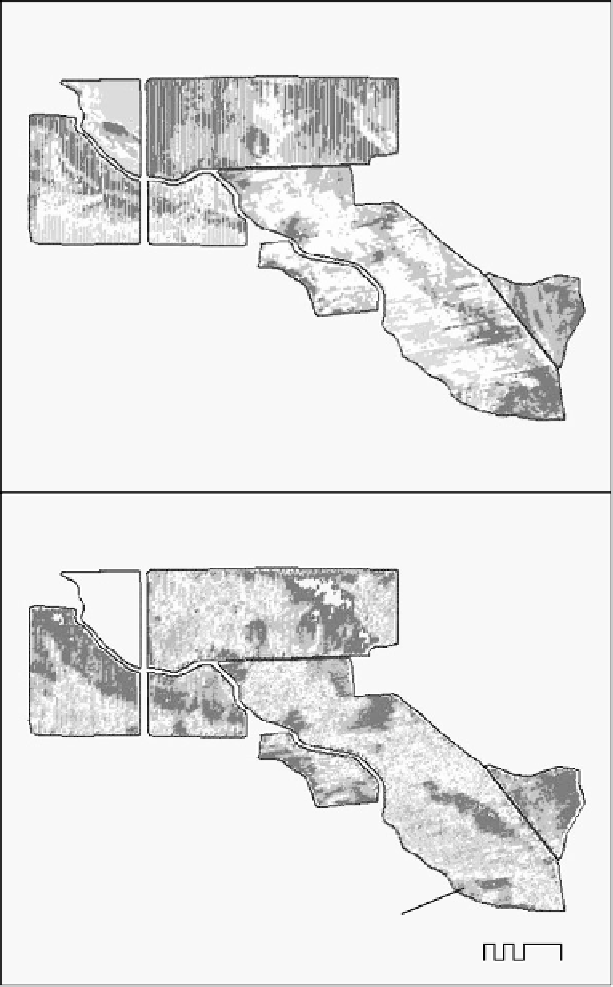
fIGURe 20.2
Maps of (a) deep EC
a
and (b) the 2003 oats yield for the irrigated fields at SAREC. (Both
maps are classified according to natural breaks.)
Spatial variation of oats yield was measured across the irrigated fields in 2003 using a combine
with a yield monitor that measured grain yield on a 9.1 m swath and recorded the spatial coordi-
nates (Figure 20.2b). A total of 59,600 yield readings were collected in the irrigated fields (except
no crop was planted in the Illinois field), representing approximately 380 data points per hectare
(or one point every 26.3 m
2
). All spatial data were organized and mapped using ArcGIS 9.0 (ESRI,
Redlands, CA).