Geoscience Reference
In-Depth Information
8
2
42
45 21 3
1
3
9
18
25
6
3
356 0
4
714 2 714182 5
11
5
5
20
5
5
1
GSC
Fig. 12.48 Array of (12
4) percentage values for amount of acidic volcanics per 40-km cell.
Central 160 km by 160 km area is same as area shown in Fig.
12.47
. Histogram values of
Fig.
12.49
are for (48
16) array of 10-km cells from within this (12
4) array (Source: Agterberg
1984
, Fig. 6)
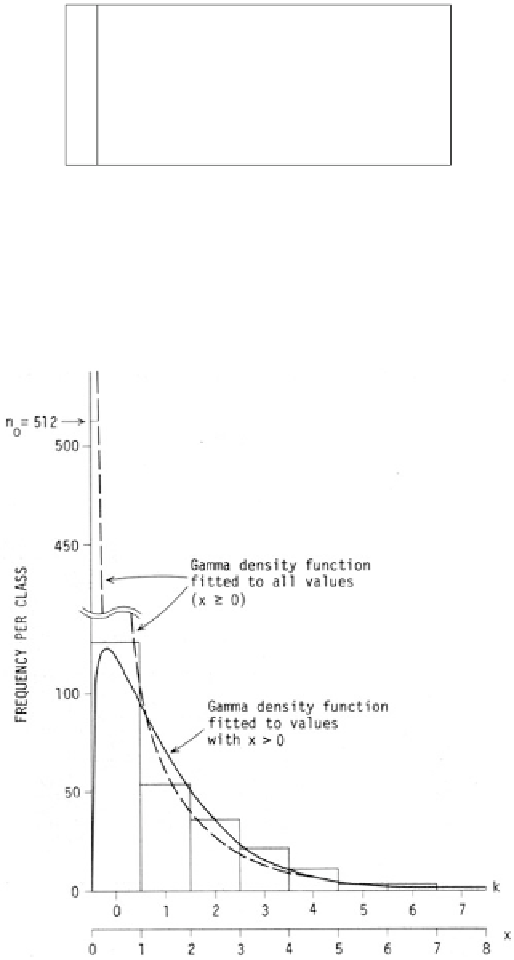
Fig. 12.49 Histogram values (
k
) contained in (48
16) array for amount of acidic volcanics per
10-km cell coinciding with array of (12
4) percentage values shown in Fig.
12.50
. Gamma
distributions were fitted to
x
¼
k
+ 0.5 with and without
n
0
¼512 zeros (Source: Agterberg
1984
,
Fig. 5)


Search WWH ::

Custom Search