Geoscience Reference
In-Depth Information
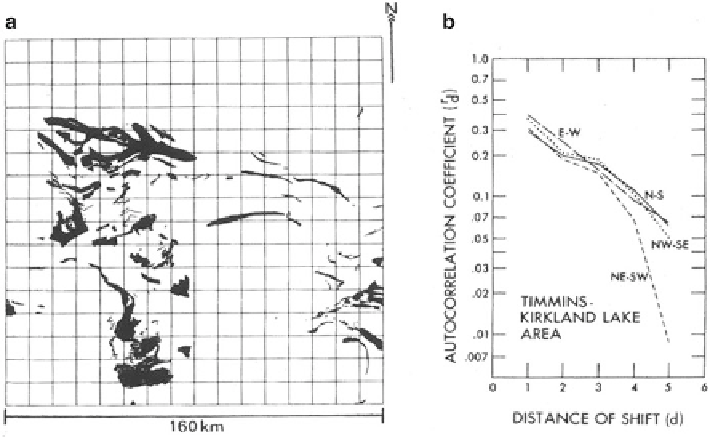
Fig. 12.47 (a) Areal distribution of acidic volcanics in a 160 km by 160 km area surrounding
Timmins and Kirkland Lake, east -central Ontario. UTM grid with 10-km cells is superimposed.
The geometrical covariance of the black and white pattern was measured on a Quantimet 720 in
four directions. (b) Autocorrelation coefficients (
r
d
) obtained from centered covariances with unit
of distance equal to 4.694 km (Source: Agterberg
1984
, Fig. 7)
12.8.4 Abitibi Acidic Volcanics Example
The second example is for a larger area measuring 480 km in the east-west
direction and 160 km in the north-south direction located within the Abitibi
Subprovince on the Canadian Shield. This study area was subdivided into
768 square (10
10 km) cells and amount of acidic volcanics was measured for
each cell. The central third with 256 (10
10 km) cells is shown in Fig.
12.47
along
with autocorrelation coefficients for four different directions estimated by the same
method used in the previous section for acidic volcanics in the Bathurst area, New
Brunswick. Percentage values for the larger Abitibi array of (40
40 km) cells are
shown in Fig.
12.48
. Best estimates of parameters for the approximately semi-
exponential autocorrelation function
r
h
¼
c
exp (
p
|
h
|) were
c
¼
0.36 and
p
¼
0.45 (Agterberg
1978a
,
1984
).
The (10
10 km) cell value frequency distribution is shown in Fig.
12.49
.
Only one-third of the 10-km cells contain acidic volcanics. Gamma density
functions were fitted successively, including and excluding the 512 empty
10-km cells with zeros (Agterberg
1977
,
1978a
). If the zeros are combined with
values of less than 10 %, and a single class is formed of all values greater than
50 %, then the gamma distribution fitted to all values is more satisfactory than the
gamma distribution fitted to nonzero values only. Application of a goodness-of-fit
Search WWH ::

Custom Search